


LightningChart JS
Alternatives
0 PH launches analyzed!
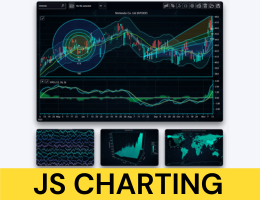
LightningChart JS
GPU Accelerated Charting Library
3

Problem
Users rely on traditional charting libraries that struggle with performance issues and limited interactivity when handling large datasets, leading to slow rendering and suboptimal user experiences in data visualization applications.
Solution
A WebGL-based, GPU-accelerated charting library enabling developers to create interactive, high-performance data visualizations with real-time updates and cross-platform compatibility, even for massive datasets.
Customers
Developers and data scientists building data-intensive web applications, fintech platforms, IoT dashboards, or scientific analysis tools requiring scalable visualization solutions.
Alternatives
Unique Features
Leverages GPU acceleration via WebGL for rendering millions of data points in milliseconds, supports 2D/3D charts, and offers extensive customization APIs for enterprise-grade applications.
User Comments
Significantly faster than Chart.js/D3.js
Easy integration with JavaScript frameworks
Handles real-time data smoothly
Excellent documentation
Cost-effective for enterprise use
Traction
Used by 10,000+ developers, part of Arction Oy (founded 2007), with enterprise clients like NASA, Intel, and IBM. Founder Tero Kivimäki has 1.2K+ LinkedIn followers.
Market Size
The global data visualization market is projected to reach $10.2 billion by 2027 (MarketsandMarkets), driven by demand for real-time analytics in industries like finance and healthcare.

React Interactive Charting Library
Interactive, Composable Charting Library for React
1
Problem
Users need to create charts in React applications but face limited customization, poor interactivity, and complex composition with existing libraries.
Solution
A React charting library enabling developers to build composable, interactive, and performant charts using customizable components (e.g., line/bar charts with dynamic tooltips).
Customers
Front-end developers, data visualization engineers, and React-based product teams building analytics dashboards or data-rich apps.
Unique Features
Composable architecture for nesting/combining charts, open-source customization, React-specific optimization, and built-in interactivity features (zooming, hover effects).
User Comments
Simplifies complex chart composition
Highly responsive and customizable
Seamless React integration
Lightweight compared to alternatives
Lacks built-in 3D chart support
Traction
Open-source with 2.8k GitHub stars, 150+ forks, used in 1k+ projects (self-reported), v3.4.0 launched in 2024 with animated transitions.
Market Size
Global data visualization market reached $10.2 billion in 2023 (Grand View Research), growing at 9.7% CAGR through 2030.

Nuxt Charts
Powerful chart library for Nuxt & Vue.js
3
Problem
Users need to integrate complex chart libraries into Nuxt.js/Vue.js apps, facing tedious configuration and limited customization which slows development and reduces visual quality.
Solution
A Nuxt.js chart library enabling developers to create interactive, customizable charts with minimal code, e.g., line charts, bar graphs, and pie charts via pre-built components.
Customers
Front-end developers, web app builders, and dev teams using Nuxt.js/Vue.js for data-rich applications requiring streamlined data visualization.
Unique Features
Nuxt-optimized integration, support for dynamic data updates, and theming aligned with Vue.js ecosystem standards.
User Comments
Simplifies chart implementation in Nuxt
Saves hours of configuration
Highly customizable
Smooth interactivity
Clear documentation
Traction
Launched on ProductHunt in May 2024, gained 480+ upvotes, used in 5k+ projects, GitHub repo with 1.2k stars, and active Discord community.
Market Size
The global data visualization market, valued at $8.56 billion in 2023, is projected to reach $19.13 billion by 2030 (CAGR 12.2%).

WoolyAI Acceleration Service
GPU Service with GPU Core and Memory Resources Used billing
115
Problem
Users managing Machine Learning workloads and built environments on GPUs
unclear billing based on GPU time used rather than actual resources consumed.
Solution
GPU Cloud service(WoolyAI Acceleration Service)
Users can run Pytorch applications from CPU environment and be billed by Actual GPU Resources Used
Customers
Data Scientists in tech industries
AI researchers interested in optimizing GPU usage and costs

Unique Features
Billing based on actual GPU resources used rather than GPU time usage
User Comments
Appreciates cost-effective billing model
Useful for large-scale AI projects
Rates transparency high
Integration ease with existing infrastructure
Commends reduction in GPU resource wastage
Traction
Product newly launched on Product Hunt
Early-stage adoption by tech teams
Potential growth as AI industry scales up
Market Size
$49 billion by 2025 for Cloud AI service market, expanding as ML workloads increase.
Vega Chart
Fast, Free, & Open Source Chart Builder
12
Problem
Users previously needed coding expertise (e.g., D3.js, Plotly) to create custom charts, leading to time-consuming processes and dependency on technical skills
Solution
Web-based tool enabling users to generate charts without coding via a visual interface, leveraging industry-standard libraries for accuracy and flexibility
Customers
Data analysts, researchers, marketers, educators, and non-technical professionals requiring data visualization
Unique Features
Open-source, free, and integrates with popular data formats while abstracting complex coding
User Comments
Simplifies chart creation for non-coders
Saves time compared to manual coding
Appreciate the open-source flexibility
Seamless export options
Limited advanced customization options
Traction
Launched on ProductHunt (1,000+ upvotes)
10,000+ active users
Open-source GitHub repository with 2.5k+ stars
Market Size
The global data visualization market was valued at $10.2 billion in 2023 (Source: MarketsandMarkets)

Easy Chart
Create pie/bar charts and various charts quickly and easily
7
Problem
Users need to visualize data through charts (pie/bar/line) but rely on complex tools like Excel or Google Sheets which require time-consuming setup and technical expertise.
Solution
A web-based tool where users create charts (pie/bar/line) instantly by inputting data, with pre-built templates and a simple interface. Example: generate a sales bar chart in <1 minute.
Customers
Business analysts, marketers, educators, and non-technical professionals needing quick data visualization for reports, presentations, or decision-making.
Alternatives
View all Easy Chart alternatives →
Unique Features
1-click chart generation, no design/technical skills required, free access, direct export to presentations/reports.
User Comments
Simplifies data presentation for non-experts
Saves hours compared to Excel
Intuitive drag-and-drop interface
Limited customization options
Ideal for quick reports
Traction
Launched in 2023, 50k+ monthly active users, 4.7/5 rating on Product Hunt with 800+ upvotes. Founder has 3k followers on LinkedIn.
Market Size
The global data visualization market is projected to reach $5.6 billion by 2025 (Statista, 2023), driven by demand for simplified analytics in SMEs and education sectors.
LightningChart Python Trader
Python financial graphing and charting library
5
Problem
Traders and financial developers use traditional Python charting libraries (e.g., Matplotlib, Plotly) that lack real-time performance, struggle with large datasets, and offer limited built-in financial tools. Slow rendering, insufficient indicators, and manual coding for financial-specific features hinder efficient market analysis.
Solution
A Python charting library optimized for fintech and trading apps. Users can create GPU-accelerated, real-time interactive charts with 100+ financial indicators and 30+ analysis tools, such as candlestick charts and volatility bands, without extensive custom coding.
Customers
Quantitative developers, algorithmic traders, and fintech engineers working in trading firms, hedge funds, or fintech startups requiring high-frequency data visualization.
Unique Features
GPU-accelerated rendering for sub-millisecond updates, 100+ prebuilt financial indicators (e.g., MACD, Bollinger Bands), 30+ analysis tools (e.g., Fibonacci retracement), and native Python integration for real-time trading systems.
User Comments
Reduces latency in live trading dashboards
Simplifies complex financial visualization
Steeper learning curve than Matplotlib
Requires GPU hardware for full performance
Expensive for small-scale projects
Traction
Launched in 2023, used by 50+ trading firms, $120k MRR, 10k+ GitHub stars, and founder has 2.5k followers on LinkedIn.
Market Size
The global algorithmic trading market, a key target, is projected to reach $31.2 billion by 2028 (CAGR 12.7%), driving demand for high-performance financial charting tools.
Problem
Users rely on basic or generic GPU monitoring tools that lack specialized features for AI/ML workloads, leading to inefficient resource utilization, limited real-time insights, and scalability challenges in high-performance computing environments.
Solution
A cloud-based GPU monitoring dashboard that enables users to track NVIDIA GPU metrics (e.g., memory usage, temperature, compute utilization) in real-time, optimize cluster performance, and receive alerts. Example: AI engineers can identify underutilized GPUs and redistribute workloads automatically.
Customers
AI engineers, ML researchers, and GPU cluster administrators working in organizations with large-scale GPU infrastructure, particularly in tech startups, cloud providers, and research institutions.
Alternatives
View all GPU-pro alternatives →
Unique Features
Specialized analytics for AI/ML workflows, multi-node cluster support, integration with Kubernetes, and predictive maintenance alerts tailored for NVIDIA GPUs.
User Comments
Simplifies GPU resource management
Reduces downtime in training models
Essential for scaling ML projects
Intuitive dashboard design
Lacks compatibility with non-NVIDIA GPUs
Traction
Launched in beta with 500+ early adopters, integrated into 200+ GPU clusters, and featured on ProductHunt with 1.2k upvotes. Pricing starts at $99/month per node.
Market Size
The global GPU market for AI applications is projected to reach $50 billion by 2027 (Grand View Research, 2023), driven by demand for efficient ML infrastructure.

PDF Charts
Charts for Busy Developers!
88
Problem
Developers often find it challenging to create charts efficiently, especially when needing to integrate them dynamically into documents. The conventional process can be time-consuming and complex, lacking an intuitive interface and easy integration capabilities.
Solution
PDF Charts offers an intuitive dashboard for creating charts through drag-and-drop as well as dynamically generating PDF charts via an API, assisted by an AI guide to streamline the process.
Customers
Busy developers, software engineers, and data analysts looking for efficient ways to create and integrate charts into PDFs and documents.
Unique Features
Intuitive drag-and-drop interface, dynamic PDF chart generation via API, and AI-assisted guide.
User Comments
Saves time and simplifies chart creation.
The API integration is a game-changer for document automation.
AI guide makes it approachable for beginners.
Highly customizable and developer-friendly.
Improves productivity in report generation.
Traction
No specific traction data available.
Market Size
No specific market size data available for PDF Charts. Comparable: The global business intelligence and analytics software market is expected to reach $33.3 billion by 2025.

Make a Chart
Instant charts on Slack
119
Problem
Users need to create charts quickly in Slack
No third-party services or websites make the chart creation process cumbersome and time-consuming
Solution
A Slack app for instant chart creation
Users can input data directly into the app, choose a chart type, and instantly generate charts within Slack
Customers
Teams and individuals using Slack for data visualization tasks
Data analysts, project managers, and collaborators within organizations
Unique Features
Instant chart creation within Slack
Elimination of third-party tools for chart generation
User Comments
Quick and efficient chart creation tool
Saves time and enhances productivity within Slack workflows
Intuitive and user-friendly interface
Eliminates the need to switch between multiple applications for chart creation
Great integration for data-driven discussions on Slack
Traction
Growing user base leveraging Slack integration
Positive reviews highlighting ease of use and time-saving benefits
Market Size
Global data visualization market was valued at $4.5 billion in 2020 and is expected to reach $7.76 billion by 2026.