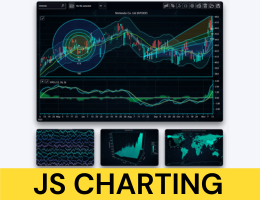
What is Nuxt Charts?
Visualize your data with Nuxt Charts. A beautiful chart library for Nuxt applications, offering easy integration and beautiful, interactive charts.
Problem
Users need to integrate complex chart libraries into Nuxt.js/Vue.js apps, facing tedious configuration and limited customization which slows development and reduces visual quality.
Solution
A Nuxt.js chart library enabling developers to create interactive, customizable charts with minimal code, e.g., line charts, bar graphs, and pie charts via pre-built components.
Customers
Front-end developers, web app builders, and dev teams using Nuxt.js/Vue.js for data-rich applications requiring streamlined data visualization.
Unique Features
Nuxt-optimized integration, support for dynamic data updates, and theming aligned with Vue.js ecosystem standards.
User Comments
Simplifies chart implementation in Nuxt
Saves hours of configuration
Highly customizable
Smooth interactivity
Clear documentation
Traction
Launched on ProductHunt in May 2024, gained 480+ upvotes, used in 5k+ projects, GitHub repo with 1.2k stars, and active Discord community.
Market Size
The global data visualization market, valued at $8.56 billion in 2023, is projected to reach $19.13 billion by 2030 (CAGR 12.2%).


