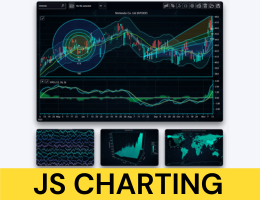
What is LightningChart JS?
LightningChart JS is a library for creating interactive and impressive data visualization applications with top performance. LightningChart JS is a WebGL-based, GPU accelerated and cross-platform charting library.
Problem
Users rely on traditional charting libraries that struggle with performance issues and limited interactivity when handling large datasets, leading to slow rendering and suboptimal user experiences in data visualization applications.
Solution
A WebGL-based, GPU-accelerated charting library enabling developers to create interactive, high-performance data visualizations with real-time updates and cross-platform compatibility, even for massive datasets.
Customers
Developers and data scientists building data-intensive web applications, fintech platforms, IoT dashboards, or scientific analysis tools requiring scalable visualization solutions.
Unique Features
Leverages GPU acceleration via WebGL for rendering millions of data points in milliseconds, supports 2D/3D charts, and offers extensive customization APIs for enterprise-grade applications.
User Comments
Significantly faster than Chart.js/D3.js
Easy integration with JavaScript frameworks
Handles real-time data smoothly
Excellent documentation
Cost-effective for enterprise use
Traction
Used by 10,000+ developers, part of Arction Oy (founded 2007), with enterprise clients like NASA, Intel, and IBM. Founder Tero Kivimäki has 1.2K+ LinkedIn followers.
Market Size
The global data visualization market is projected to reach $10.2 billion by 2027 (MarketsandMarkets), driven by demand for real-time analytics in industries like finance and healthcare.


