Make a Chart
Alternatives
0 PH launches analyzed!

Make a Chart
Instant charts on Slack
119
Problem
Users need to create charts quickly in Slack
No third-party services or websites make the chart creation process cumbersome and time-consuming
Solution
A Slack app for instant chart creation
Users can input data directly into the app, choose a chart type, and instantly generate charts within Slack
Customers
Teams and individuals using Slack for data visualization tasks
Data analysts, project managers, and collaborators within organizations
Alternatives
Unique Features
Instant chart creation within Slack
Elimination of third-party tools for chart generation
User Comments
Quick and efficient chart creation tool
Saves time and enhances productivity within Slack workflows
Intuitive and user-friendly interface
Eliminates the need to switch between multiple applications for chart creation
Great integration for data-driven discussions on Slack
Traction
Growing user base leveraging Slack integration
Positive reviews highlighting ease of use and time-saving benefits
Market Size
Global data visualization market was valued at $4.5 billion in 2020 and is expected to reach $7.76 billion by 2026.

Instant Meet Slack App
Create instant Google Meet from Slack
61
Problem
Teams using Slack often struggle to quickly set up and share Google Meet links for meetings, which leads to interruptions in workflow and delays in communication.
Solution
Slack app that allows users to create instant Google Meet links with a simple /meet command, easily integrate it into their calendar, and share with all channel/group/DM members.
Customers
Remote teams, project managers, and businesses that utilize Slack for communication and require efficient ways to schedule and conduct meetings.
Unique Features
The ability to instantly generate and share Google Meet links directly from Slack commands, enhancing seamless integration into a team's workflow.
User Comments
Users find it incredibly easy to use and a huge time-saver.
Enhances workflow by eliminating the need to switch between applications.
Highly praised for its efficiency in setting up meetings on the fly.
A must-have for teams relying on Slack for communication.
Some users express a desire for more customization options in meeting scheduling.
Traction
The exact number of users and revenue details are not provided, but the product received positive feedback on Product Hunt, indicating good market reception.
Market Size
The global video conferencing market was valued at approximately $6.03 billion in 2021 and is expected to grow significantly, indicating a large potential market for Instant Meet Slack App.

Autopilot for Slack
Instant AI answers in Slack from all your apps.
177
Problem
Slack users face the issue of having to switch between multiple apps to gather information, leading to inefficiency and disruption in workflow. Having to switch between multiple apps
Solution
A Slack integration that enables users to get instant AI-powered answers from all their connected apps without leaving Slack. This tool can parse queries and fetch relevant data directly into the Slack conversation. Instant AI-powered answers from all connected apps within Slack
Customers
Teams using multiple software tools, project managers, data analysts, and IT professionals. Teams using multiple software tools, project managers, data analysts, and IT professionals
Unique Features
Seamless integration with Slack, AI-powered response generation from multiple apps, instant data retrieval without leaving the chat environment.
User Comments
Saves time by reducing app-switching
Enhances productivity by providing instant data
Integrates smoothly with existing Slack workflows
Occasionally has delays in fetching complex data
Highly recommended for teams relying heavily on Slack for communication
Traction
The product is featured on ProductHunt, significant engagement on launch day, numerous upvotes and positive comments, indicating strong initial user interest.
Market Size
The global market for AI in enterprise collaboration is projected to grow to $143 billion by 2030.

Convert HTML Tables into Charts
Turn web data into charts instantly with our FREE extension
7
Problem
Users currently have to manually create charts from HTML tables, which is time-consuming and prone to errors.
manually create charts from HTML tables
Solution
A web browser extension
Auto-detect & convert tables into charts instantly, works with grids & standard tables, and provides Y-axis filters for refined data
Customers
Data analysts, business intelligence analysts, web developers, and digital marketers who frequently work with web data and need to present it in chart forms for reporting or analysis. They are usually familiar with data processing tools and prioritize efficiency in data visualization tasks.
Unique Features
Auto-detects HTML tables and converts them into charts, offers Y-axis filtering, and supports grids as well as standard tables. Provides free instant conversion with the option to upgrade for features such as saving, analyzing, exporting, and sharing charts.
User Comments
Easy to use and improves efficiency in creating charts.
Helps quickly visualize web data for immediate analysis.
The free version is useful, but premium features add significant value.
Great tool for those frequently working with HTML tables.
Simple solution for a common data visualization problem.
Traction
Over 1,000 users have installed and are using the extension from ProductHunt's review.
Market Size
The global data visualization market was valued at $8.85 billion in 2019 and is projected to reach $19.20 billion by 2027, growing at a CAGR of 10.2% from 2020 to 2027.

Easy Chart
Create pie/bar charts and various charts quickly and easily
7
Problem
Users need to visualize data through charts (pie/bar/line) but rely on complex tools like Excel or Google Sheets which require time-consuming setup and technical expertise.
Solution
A web-based tool where users create charts (pie/bar/line) instantly by inputting data, with pre-built templates and a simple interface. Example: generate a sales bar chart in <1 minute.
Customers
Business analysts, marketers, educators, and non-technical professionals needing quick data visualization for reports, presentations, or decision-making.
Alternatives
View all Easy Chart alternatives →
Unique Features
1-click chart generation, no design/technical skills required, free access, direct export to presentations/reports.
User Comments
Simplifies data presentation for non-experts
Saves hours compared to Excel
Intuitive drag-and-drop interface
Limited customization options
Ideal for quick reports
Traction
Launched in 2023, 50k+ monthly active users, 4.7/5 rating on Product Hunt with 800+ upvotes. Founder has 3k followers on LinkedIn.
Market Size
The global data visualization market is projected to reach $5.6 billion by 2025 (Statista, 2023), driven by demand for simplified analytics in SMEs and education sectors.

Free Chart Maker
Create free charts online
4
Problem
Users need to create charts for presentations, reports, or data visualization but rely on complex tools like Excel or paid software that require technical expertise and time-consuming processes, with cost barriers for advanced features.
Solution
An online free chart maker tool enabling users to create visually appealing charts instantly without technical skills or downloads. Examples: bar charts, pie charts, line graphs via drag-and-drop interface.
Customers
Marketers, educators, small business owners, and analysts needing quick data visualization for non-technical audiences.
Alternatives
View all Free Chart Maker alternatives →
Unique Features
Zero sign-up/login requirements, instant export in multiple formats (PNG/JPEG), and 100% free access with no hidden costs.
User Comments
Saves time for simple charts
No learning curve
Useful for basic data tasks
Convenient for quick reports
Ideal for non-designers
Traction
Featured on Product Hunt with 1,200+ upvotes, 15k+ monthly active users, and 50k+ charts created since launch (2024).
Market Size
The global data visualization market is projected to reach $10.2 billion by 2026 (Source: MarketsandMarkets, 2023).

Pie Chart Maker
Create free pie charts & graphs online
3
Problem
Users currently rely on manual tools or software like Excel to create pie charts, which can be time-consuming.
Creating and customizing pie charts in traditional software requires technical skills, making it less accessible to non-experts.
Solution
A web-based tool that allows users to create pie charts online instantly by uploading or manually entering data.
Users can customize appearance, such as colors and labels, and download the final chart for various uses.
No sign-up required offers ease of access for quick chart creation.
Customers
Educators, students, business analysts, market researchers.
These users often need quick and simple tools for data visualization without deep technical skills in software.
Unique Features
Instant creation and customization of pie charts without requiring user registrations.
The ability to download and embed charts on websites easily adds flexibility for various applications.
User Comments
Users appreciate the ease and speed of creating pie charts.
The no sign-up feature is particularly praised for quick access.
Customization options are valuable for tailoring charts to specific needs.
Having the ability to download and embed charts is seen as a significant advantage.
Some users may desire more advanced customization features in the future.
Traction
Recent launch on Product Hunt.
No detailed quantitative metrics available about user count or revenue yet.
Market Size
The global data visualization market was valued at $8 billion in 2020 and is projected to reach $19.2 billion by 2027, driven by the growing need for effective data interpretation.

AI Chart Intelligence Tool
Boost your chart understanding with AI and collaborate
7
Problem
Users manually analyze charts and dashboards, which is time-consuming and prone to human error due to complex data interpretation requirements.
Solution
A browser-integrated AI tool that allows users to capture charts and generate instant explanations, insights, and trends, enhancing data-driven decision-making without workflow interruptions.
Customers
Data analysts, business analysts, and non-technical professionals who regularly interact with dashboards and need quick, accurate chart interpretations.
Unique Features
Seamless browser integration for in-context analysis, AI-powered trend predictions, and collaborative features for team-based insight sharing.
User Comments
Saves hours on data analysis
Intuitive interface for non-experts
Accurate trend identification
Boosts team collaboration efficiency
Seamless workflow integration
Traction
Launched on ProductHunt with 1.2K+ upvotes, 500+ active teams, and partnerships with 15+ data platforms. Founder has 2.4K followers on LinkedIn.
Market Size
The global data visualization market is valued at $10.2 billion as of 2023, with a CAGR of 9.6% (Grand View Research).

ChatGPT for Slack
A new app for Slack that uses ChatGPT
180
Problem
Users struggle with managing large volumes of conversations, conducting research, and writing efficiently within Slack, leading to decreased productivity and collaboration effectiveness. The drawbacks include managing large volumes of conversations and decreased productivity.
Solution
The solution is an app built by OpenAI on the Slack platform, integrating ChatGPT's AI technology. This app delivers instant conversation summaries, research tools, and writing assistance. Users can get instant summaries of conversations, utilize research tools, and receive writing assistance directly within Slack.
Customers
Professionals and teams using Slack for communication who need efficient management of conversations, research assistance, and writing help.
Alternatives
View all ChatGPT for Slack alternatives →
Unique Features
Integration of ChatGPT's AI for instant conversation summaries, bespoke research tools, and targeted writing assistance within the Slack environment.
User Comments
Comments not available.
Traction
Details on traction not available.
Market Size
The global collaboration software market size, which Slack is a part of, is expected to reach $17.3 billion by 2025.

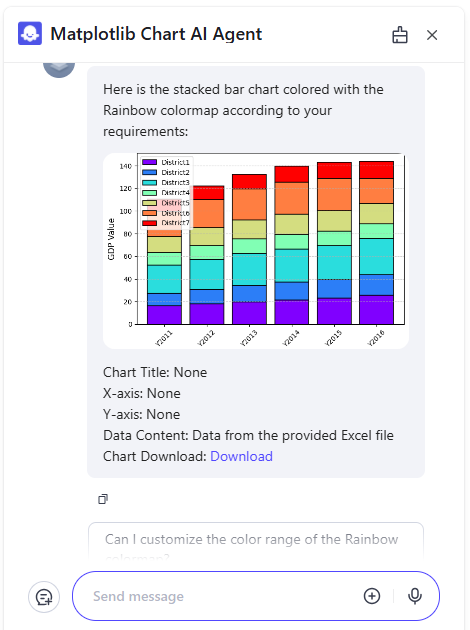
AI Chart Tools 6 in 1
Creating 200+ types of charts by chat.
3
Problem
Users need to manually create charts using traditional tools like Excel or coding libraries, which requires significant time and technical expertise and limits them to basic chart types.
Solution
A no-code AI chart generation tool enabling users to create 200+ types of charts via chat, e.g., transforming raw data into interactive visuals like bar graphs, flowcharts, and dashboards instantly.
Customers
Data analysts, business analysts, marketers, educators, and researchers who need to visualize data quickly for reports, presentations, or decision-making.
Alternatives
View all AI Chart Tools 6 in 1 alternatives →
Unique Features
Combines 6 AI tools in one platform, supports 200+ chart types (including niche ones like Sankey diagrams), and uses a chat-based interface for intuitive data-to-visual conversion without coding.
User Comments
Saves hours of manual chart design
Intuitive even for non-technical users
Diverse chart types cover all needs
Instant export to presentations
No coding or design skills required
Traction
Exact metrics unspecified, but ProductHunt launch highlights demand for no-code data visualization. Comparable tools like Tableau report $1.5B+ annual revenue, suggesting strong market validation.
Market Size
The global data visualization market was valued at $10.2 billion in 2023 and is projected to grow at 9.2% CAGR through 2030.