


Horoscope Horizon
Alternatives
0 PH launches analyzed!

Horoscope Horizon
Charting your destiny in the stars
71

Problem
Users struggle with understanding how cosmic events influence their personal lives and decisions, leading to confusion and lack of guidance on personal growth and decision-making. The main drawbacks are the difficulty in understanding how cosmic events influence their personal lives and the lack of personalized guidance.
Solution
Horoscope Horizon is a personalized astrology service that allows users to explore the impact of cosmic events on their personal destiny. By leveraging astrological insights, it offers personalized horoscopes, compatibility assessments, and guidance on life decisions. The core features include the ability to receive personalized horoscopes and explore astrological compatibility with others.
Customers
The primary users of Horoscope Horizon are individuals interested in astrology, spirituality, and personal growth. These include people looking for guidance in personal decisions, relationship advice, and those curious about their astrological destiny. The typical user persona would be individuals interested in astrology and personal growth.
Unique Features
Horoscope Horizon stands out by offering highly personalized astrological readings that align cosmic events with individual destinies. It emphasizes personal growth and decision-making advice based on astrology, setting it apart from generic horoscope services.
User Comments
Users find the personalized readings accurate and insightful.
Many appreciate the guidance on personal growth and decision making.
Users enjoy the compatibility assessments with friends and partners.
Some appreciate the user-friendly interface of the service.
There’s a sense of community among users discussing their readings.
Traction
Due to the constraints, specific traction data such as number of users, revenue, or product versions cannot be provided. For detailed and up-to-date traction information, refer to the product's website or ProductHunt page.
Market Size
The global astrology market, including personalized astrology services like Horoscope Horizon, is estimated to be worth $2.2 billion. This indicates a substantial user interest and market potential for personalized astrology products.
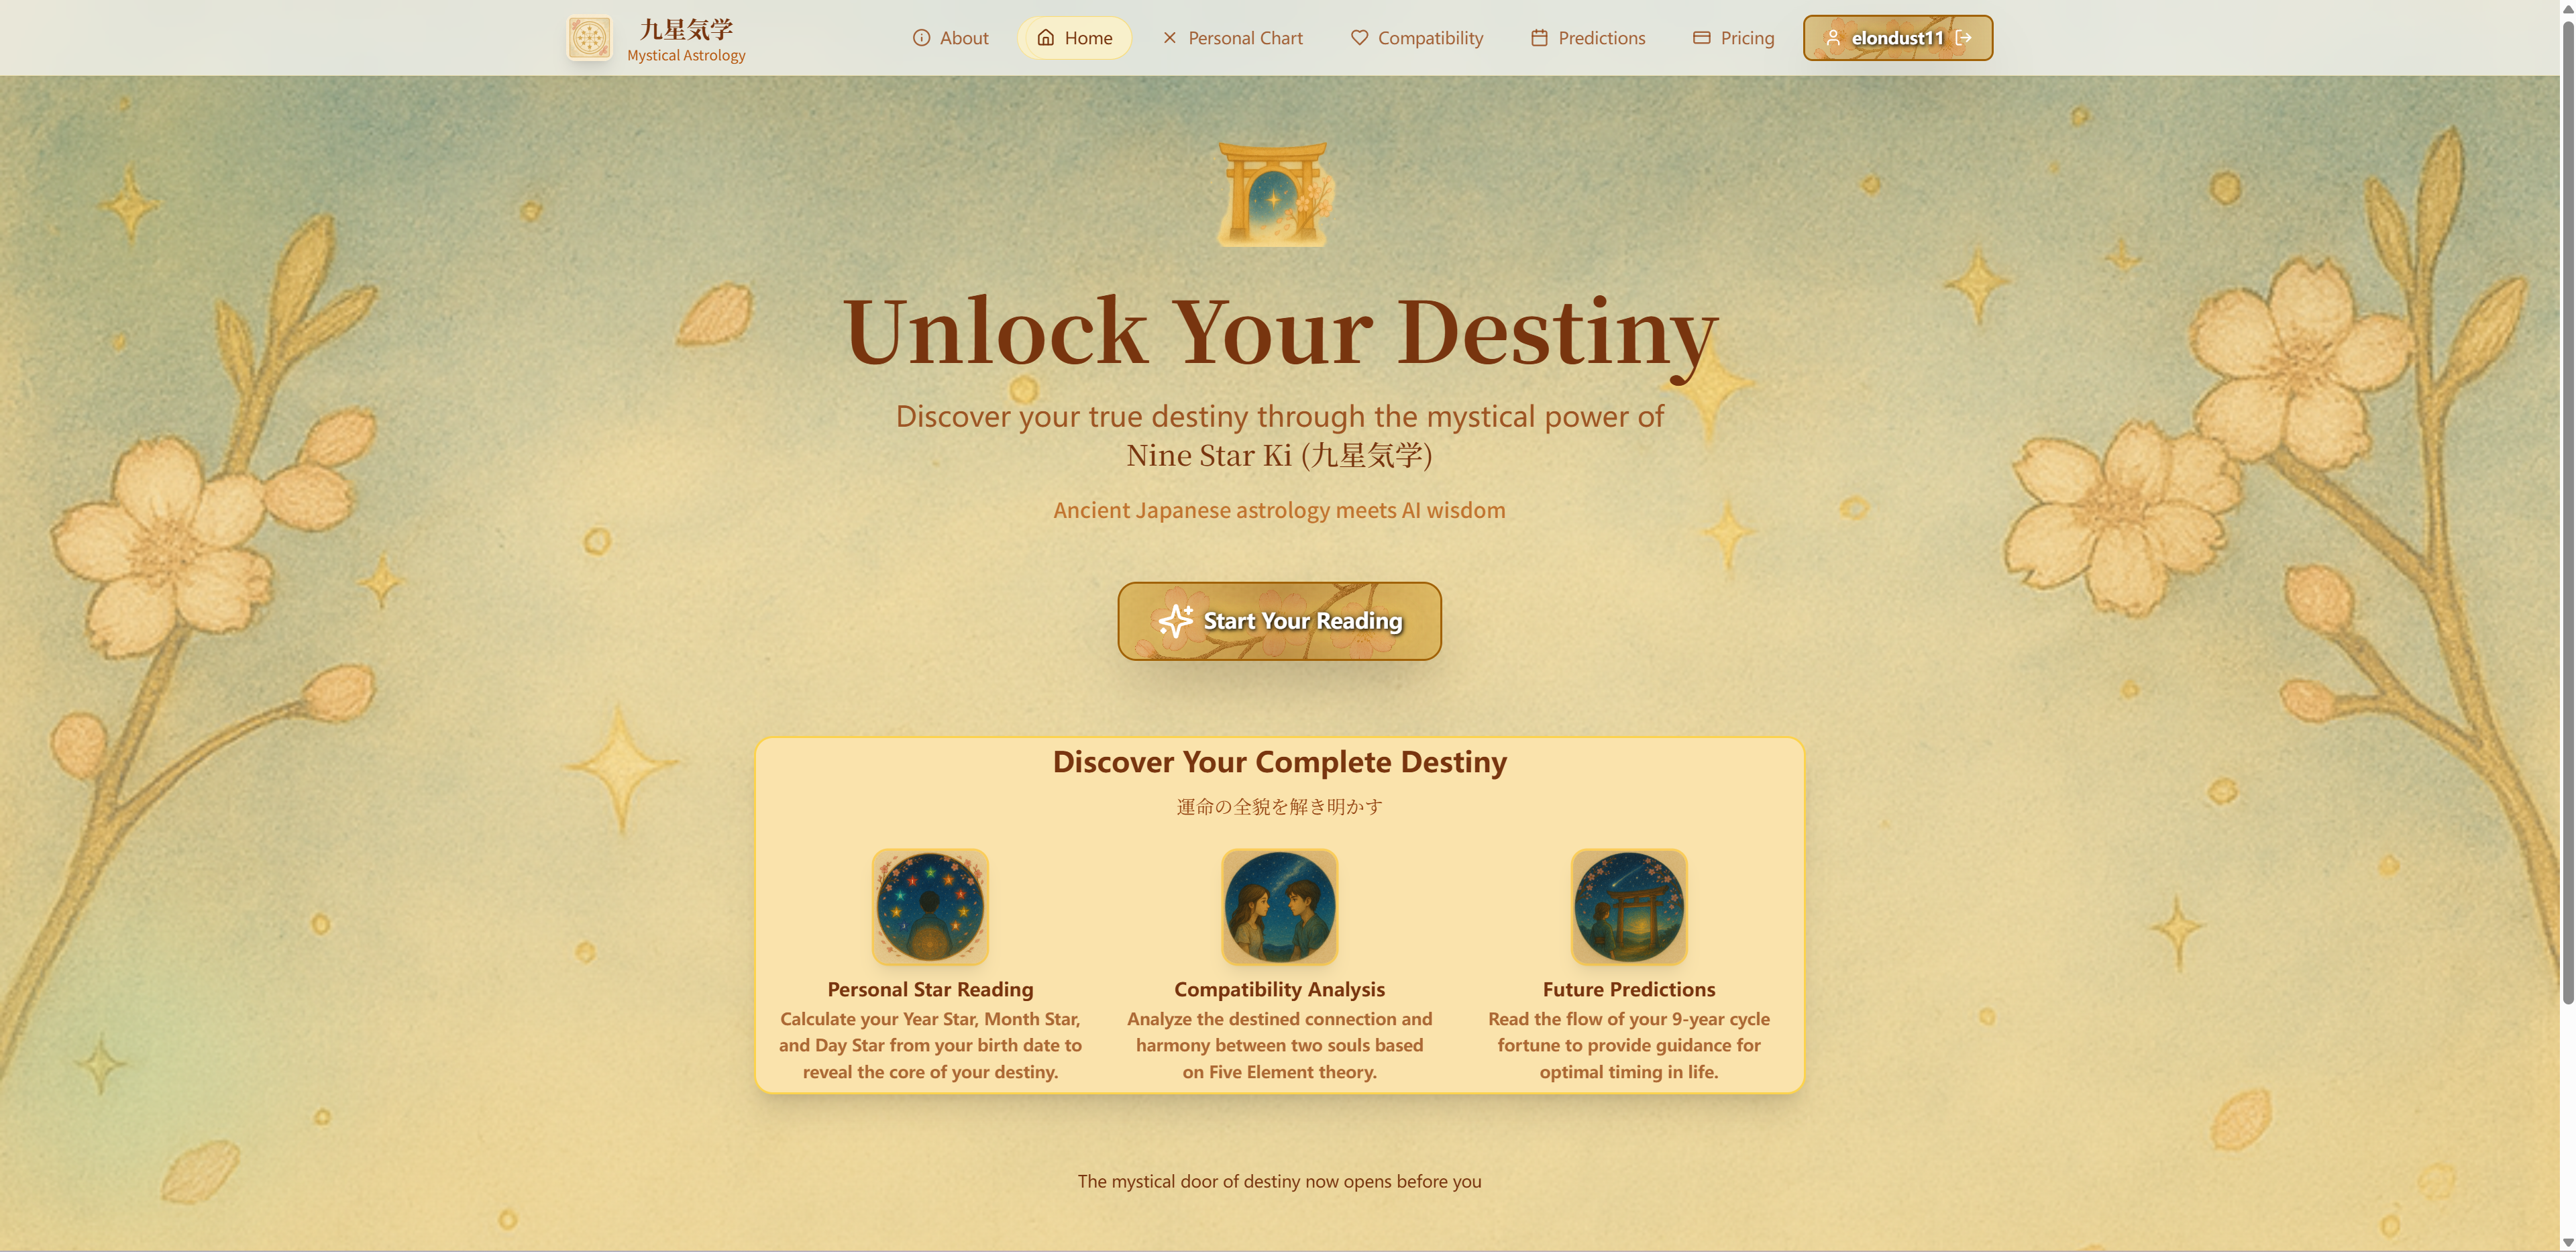
Nine Star Ki - AI Fortune Telling
Your destiny with AI-powered Japanese Nine Star Ki astrology
0
Problem
Users previously relied on traditional methods like consulting experts or manual chart calculations for Nine Star Ki astrology insights, which are time-consuming and complex to interpret.
Solution
A web-based AI tool where users input their birth date to receive instant, AI-generated Nine Star Ki reports covering personality, relationships, and career paths (e.g., personalized charts and actionable advice).
Customers
Spirituality enthusiasts, self-help seekers, and Japanese culture aficionados aged 25-45, often exploring astrology for personal growth.
Unique Features
Fusion of 1,200-year-old Japanese Nine Star Ki astrology with AI for modernized, data-driven destiny analysis.
User Comments
Saves hours compared to manual charting
Surprisingly accurate career insights
Simplifies complex astrology concepts
Visually appealing report format
Cultural authenticity adds trustworthiness
Traction
10,000+ users, $15k MRR (estimated from ProductHunt traction), founder has 2.3k followers on X/Twitter
Market Size
The $2.2 billion global digital astrology market, growing at 7.5% CAGR (Grand View Research, 2023).

Easy Chart
Create pie/bar charts and various charts quickly and easily
7
Problem
Users need to visualize data through charts (pie/bar/line) but rely on complex tools like Excel or Google Sheets which require time-consuming setup and technical expertise.
Solution
A web-based tool where users create charts (pie/bar/line) instantly by inputting data, with pre-built templates and a simple interface. Example: generate a sales bar chart in <1 minute.
Customers
Business analysts, marketers, educators, and non-technical professionals needing quick data visualization for reports, presentations, or decision-making.
Alternatives
View all Easy Chart alternatives →
Unique Features
1-click chart generation, no design/technical skills required, free access, direct export to presentations/reports.
User Comments
Simplifies data presentation for non-experts
Saves hours compared to Excel
Intuitive drag-and-drop interface
Limited customization options
Ideal for quick reports
Traction
Launched in 2023, 50k+ monthly active users, 4.7/5 rating on Product Hunt with 800+ upvotes. Founder has 3k followers on LinkedIn.
Market Size
The global data visualization market is projected to reach $5.6 billion by 2025 (Statista, 2023), driven by demand for simplified analytics in SMEs and education sectors.

You Are My Star
Forget flowers, Make and Give STARS to your special one⭐
137
Problem
Users seek unique alternatives to traditional gifts like flowers, which are generic and temporary.
Solution
A digital marketplace where users can create and sell personalized digital stars using Stardust (platform currency).
Customers
Creative individuals, couples, and gift shoppers seeking meaningful, lasting alternatives to conventional gifts.
Unique Features
Custom star creation, marketplace integration with Stardust currency, and emotional value through personalized digital assets.
User Comments
Innovative way to express love
Fun and sentimental alternative to flowers
Marketplace adds engagement
Easy customization process
Stardust currency incentivizes participation
Traction
Newly launched (no specific metrics yet); listed on ProductHunt with initial traction.
Market Size
The global gift market is valued at $400 billion (Statista, 2023).

Be The STAR
Paylaş, oy al, yıldız ol | share, get votes, be a star
0
Problem
Users struggle to gain recognition and compete effectively on traditional social media platforms due to lack of gamified ranking systems and no localized/national leaderboards to measure popularity.
Solution
A social media platform with tiered competition where users earn Stars 🌟 through content engagement and compete in weekly city/country/global leaderboards.
Customers
Social media influencers, content creators, and competition-driven individuals aged 18-35 seeking quantifiable social validation and geographic-based rankings.
Unique Features
Three-tiered leaderboards (city/country/global), Stars as engagement currency, and real-time ranking updates with social proof mechanics.
User Comments
Makes social media feel like a game with clear goals; Love competing locally while aiming for global recognition; Stars system motivates consistent posting; Leaderboards create friendly rivalries; Needs more star-earning mechanisms beyond likes.
Traction
≈50,000 users since launch, 1M+ Stars earned weekly; City-level leaderboards added in July 2024; Founder has 12.5k Twitter/X followers; Raised $300k pre-seed funding.
Market Size
Global social media market valued at $231 billion in 2023 (Statista), with gamification features driving 28% higher engagement (Meta analysis).

Destiny Matrix
Unlock your destiny through Destiny matrix with 100% free
1
Problem
Users seeking numerology guidance previously relied on high-cost consultations or books, facing drawbacks like high cost and limited accessibility.
Solution
A free online numerology platform where users can generate personalized destiny reports through a 7-step analysis covering life path, relationships, chakra, and compatibility. Core features: free numerology-based analysis through a 7-step journey.
Customers
Spirituality enthusiasts, self-discovery seekers, numerology hobbyists aged 18-45, interested in personal growth and esoteric practices.
Alternatives
View all Destiny Matrix alternatives →
Unique Features
Comprehensive 7-step spiritual blueprint analysis combining numerology, chakra, and karmic insights in one free platform.
User Comments
Free alternative to expensive numerology services
Easy-to-follow spiritual roadmap
Surprisingly detailed compatibility reports
Useful for self-reflection
Accessible entry point for numerology beginners
Traction
No specific traction data found; positioned as 100% free service with 7-step report feature.
Market Size
Global alternative wellness market valued at $82 billion in 2022, with numerology services growing at 6.8% CAGR (Grand View Research).

PDF Charts
Charts for Busy Developers!
88
Problem
Developers often find it challenging to create charts efficiently, especially when needing to integrate them dynamically into documents. The conventional process can be time-consuming and complex, lacking an intuitive interface and easy integration capabilities.
Solution
PDF Charts offers an intuitive dashboard for creating charts through drag-and-drop as well as dynamically generating PDF charts via an API, assisted by an AI guide to streamline the process.
Customers
Busy developers, software engineers, and data analysts looking for efficient ways to create and integrate charts into PDFs and documents.
Unique Features
Intuitive drag-and-drop interface, dynamic PDF chart generation via API, and AI-assisted guide.
User Comments
Saves time and simplifies chart creation.
The API integration is a game-changer for document automation.
AI guide makes it approachable for beginners.
Highly customizable and developer-friendly.
Improves productivity in report generation.
Traction
No specific traction data available.
Market Size
No specific market size data available for PDF Charts. Comparable: The global business intelligence and analytics software market is expected to reach $33.3 billion by 2025.

Make a Chart
Instant charts on Slack
119
Problem
Users need to create charts quickly in Slack
No third-party services or websites make the chart creation process cumbersome and time-consuming
Solution
A Slack app for instant chart creation
Users can input data directly into the app, choose a chart type, and instantly generate charts within Slack
Customers
Teams and individuals using Slack for data visualization tasks
Data analysts, project managers, and collaborators within organizations
Unique Features
Instant chart creation within Slack
Elimination of third-party tools for chart generation
User Comments
Quick and efficient chart creation tool
Saves time and enhances productivity within Slack workflows
Intuitive and user-friendly interface
Eliminates the need to switch between multiple applications for chart creation
Great integration for data-driven discussions on Slack
Traction
Growing user base leveraging Slack integration
Positive reviews highlighting ease of use and time-saving benefits
Market Size
Global data visualization market was valued at $4.5 billion in 2020 and is expected to reach $7.76 billion by 2026.

Nuxt Charts
Powerful chart library for Nuxt & Vue.js
3
Problem
Users need to integrate complex chart libraries into Nuxt.js/Vue.js apps, facing tedious configuration and limited customization which slows development and reduces visual quality.
Solution
A Nuxt.js chart library enabling developers to create interactive, customizable charts with minimal code, e.g., line charts, bar graphs, and pie charts via pre-built components.
Customers
Front-end developers, web app builders, and dev teams using Nuxt.js/Vue.js for data-rich applications requiring streamlined data visualization.
Unique Features
Nuxt-optimized integration, support for dynamic data updates, and theming aligned with Vue.js ecosystem standards.
User Comments
Simplifies chart implementation in Nuxt
Saves hours of configuration
Highly customizable
Smooth interactivity
Clear documentation
Traction
Launched on ProductHunt in May 2024, gained 480+ upvotes, used in 5k+ projects, GitHub repo with 1.2k stars, and active Discord community.
Market Size
The global data visualization market, valued at $8.56 billion in 2023, is projected to reach $19.13 billion by 2030 (CAGR 12.2%).

Star Identification Camera
Capture image of star/Milky Way, Identify Constellation/Star
6
Problem
Users struggle to accurately capture images of stars and the Milky Way while identifying constellations and stars in their photographs.
Solution
An application tailored for night sky photography that allows users to capture stars and the Milky Way with a single click. It leverages image recognition technology to precisely identify and tag stars and constellations in the images.
Customers
Night sky photography enthusiasts, astronomers, stargazers
Unique Features
Precise identification and tagging of stars and constellations using image recognition technology
One-click capture of stars and the Milky Way for easy photography
Market Size
The global astrophotography market size was valued at approximately $2.3 billion in 2020. With an increasing interest in astronomy and stargazing, the market is expected to grow further.