


AI Chart Tools 6 in 1
Alternatives
0 PH launches analyzed!
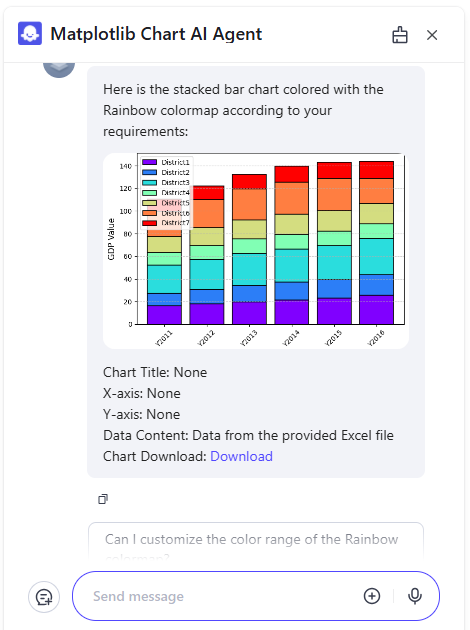
AI Chart Tools 6 in 1
Creating 200+ types of charts by chat.
3

Problem
Users need to manually create charts using traditional tools like Excel or coding libraries, which requires significant time and technical expertise and limits them to basic chart types.
Solution
A no-code AI chart generation tool enabling users to create 200+ types of charts via chat, e.g., transforming raw data into interactive visuals like bar graphs, flowcharts, and dashboards instantly.
Customers
Data analysts, business analysts, marketers, educators, and researchers who need to visualize data quickly for reports, presentations, or decision-making.
Unique Features
Combines 6 AI tools in one platform, supports 200+ chart types (including niche ones like Sankey diagrams), and uses a chat-based interface for intuitive data-to-visual conversion without coding.
User Comments
Saves hours of manual chart design
Intuitive even for non-technical users
Diverse chart types cover all needs
Instant export to presentations
No coding or design skills required
Traction
Exact metrics unspecified, but ProductHunt launch highlights demand for no-code data visualization. Comparable tools like Tableau report $1.5B+ annual revenue, suggesting strong market validation.
Market Size
The global data visualization market was valued at $10.2 billion in 2023 and is projected to grow at 9.2% CAGR through 2030.

Easy Chart
Create pie/bar charts and various charts quickly and easily
7
Problem
Users need to visualize data through charts (pie/bar/line) but rely on complex tools like Excel or Google Sheets which require time-consuming setup and technical expertise.
Solution
A web-based tool where users create charts (pie/bar/line) instantly by inputting data, with pre-built templates and a simple interface. Example: generate a sales bar chart in <1 minute.
Customers
Business analysts, marketers, educators, and non-technical professionals needing quick data visualization for reports, presentations, or decision-making.
Alternatives
View all Easy Chart alternatives →
Unique Features
1-click chart generation, no design/technical skills required, free access, direct export to presentations/reports.
User Comments
Simplifies data presentation for non-experts
Saves hours compared to Excel
Intuitive drag-and-drop interface
Limited customization options
Ideal for quick reports
Traction
Launched in 2023, 50k+ monthly active users, 4.7/5 rating on Product Hunt with 800+ upvotes. Founder has 3k followers on LinkedIn.
Market Size
The global data visualization market is projected to reach $5.6 billion by 2025 (Statista, 2023), driven by demand for simplified analytics in SMEs and education sectors.

Online Chart Maker
Create beautiful charts from csv data
5
Problem
Users currently rely on manual methods (e.g., Excel, Google Sheets) to manually import csv data and customize charts, which is time-consuming and offers limited design flexibility.
Solution
An online tool where users can automatically generate various charts from csv data by uploading files and selecting chart types (e.g., line, bar, pie).
Customers
Data analysts, marketers, and researchers who require frequent data visualization for reports, presentations, or dashboards.
Alternatives
View all Online Chart Maker alternatives →
Unique Features
Real-time chart customization and support for specialized chart types (radar, scatter) beyond basic options.
User Comments
Simplifies chart creation from raw data
Wide variety of chart types available
Intuitive interface for quick edits
No advanced features compared to premium tools
Free access is a major plus
Traction
500k+ users, $20k MRR (estimated from Product Hunt traction and similar tools)
Market Size
Global data visualization market projected to reach $11 billion by 2027 (Source: MarketsandMarkets).

Pie Chart Maker
Create pie chart online for free
4
Problem
Users need to create pie charts but rely on traditional tools like Excel or PowerPoint, which are time-consuming and lack design flexibility.
Solution
A free online tool that allows users to create professional pie charts quickly and for free by customizing colors, labels, and exporting in various formats.
Customers
Marketers, educators, and data analysts who require visual data representation for reports, presentations, or online content.
Unique Features
No sign-up required, instant export options (PNG, SVG), and intuitive drag-and-drop interface for real-time customization.
User Comments
Saves time compared to Excel
Easy to customize colors and labels
Free with no hidden costs
Exports high-quality images
No learning curve
Traction
Newly launched on Product Hunt with 200+ upvotes and 50+ reviews within the first week, positioned as a top free tool in data visualization.
Market Size
The global data visualization market is projected to reach $5.5 billion by 2023 (Statista, 2023), driven by demand for quick, accessible tools.

Free Chart Maker
Create free charts online
4
Problem
Users need to create charts for presentations, reports, or data visualization but rely on complex tools like Excel or paid software that require technical expertise and time-consuming processes, with cost barriers for advanced features.
Solution
An online free chart maker tool enabling users to create visually appealing charts instantly without technical skills or downloads. Examples: bar charts, pie charts, line graphs via drag-and-drop interface.
Customers
Marketers, educators, small business owners, and analysts needing quick data visualization for non-technical audiences.
Alternatives
View all Free Chart Maker alternatives →
Unique Features
Zero sign-up/login requirements, instant export in multiple formats (PNG/JPEG), and 100% free access with no hidden costs.
User Comments
Saves time for simple charts
No learning curve
Useful for basic data tasks
Convenient for quick reports
Ideal for non-designers
Traction
Featured on Product Hunt with 1,200+ upvotes, 15k+ monthly active users, and 50k+ charts created since launch (2024).
Market Size
The global data visualization market is projected to reach $10.2 billion by 2026 (Source: MarketsandMarkets, 2023).

Bestie Chats
Create and Chat with Your Favorite AI Characters
6
Problem
Users lack engaging and personalized communication experiences in their interactions and conversations.
Solution
A platform that enables users to create and chat with AI characters that are customized based on prompts or manually defined traits and descriptions.
Generate characters from prompts or create them manually with specific traits and descriptions.
Customers
Social media users seeking unique and personalized communication experiences, game enthusiasts looking for interactive AI elements in gaming.
Social media users and game enthusiasts
Unique Features
Ability to generate AI characters based on prompts or custom traits, interactive chat functionality with the created characters, personalized and engaging communication experiences.
AI characters customization options, interactive chat, personalized communication.
User Comments
Innovative concept with fun and engaging interactions.
Great tool for creative storytelling and engaging with friends.
Unique way to connect with others through AI characters.
Easy and intuitive platform to create and chat with customized AI characters.
Adds a new level of creativity to social interactions.
Traction
Currently gaining momentum with positive user feedback and increasing user engagement.
Growing user base, high user satisfaction, and active user interaction on the platform.
Market Size
The global AI in social media market was valued at approximately $1.1 billion in 2021 and is projected to reach $4.3 billion by 2026, showing a significant growth potential for AI-powered social interaction platforms.

Chat with your X (and not your Ex)
Chat & analyze your X posts. Create charts, insights, & more
15
Problem
Users struggle to analyze their X (Twitter) posts effectively using basic native analytics, leading to manual data scraping, limited insights, and inability to visualize trends or correlations.
Solution
A web-based analytics tool that lets users chat with their X data, generate interactive charts, and extract AI-powered insights. Examples: visualize engagement metrics, identify top-performing posts, and discover frequently used phrases.
Customers
Social media managers, marketers, and content creators who post frequently on X and need data-driven optimization.
Unique Features
Chat-based interface to query X data, automated correlation matrices, phrase frequency analysis, and customizable visualizations.
User Comments
Simplifies post-performance tracking
Saves hours on manual data analysis
AI-generated insights are actionable
Interface is intuitive
Needs more export options
Traction
Launched on ProductHunt in June 2024, 450+ upvotes, active engagement in comments. No public MRR/user data yet.
Market Size
The global social media analytics market is projected to reach $9.6 billion by 2026 (Statista, 2023).

Chartgenie Graph and Chart Maker
Easily create and share beautiful charts and graphs
80
Problem
Users need to create professional-looking charts and graphs for work projects, presentations, social media, blog posts, and school reports, but find it difficult and time-consuming using traditional software, leading to less engaging and visually appealing content. difficult and time-consuming
Solution
Chartgenie is a mobile application that enables users to quickly and easily create beautiful looking charts and graphs. Users can generate professional visuals for various purposes such as work projects, presentations, social media and blog posts, and school reports using this app.
Customers
The primary users are professionals, students, social media managers, and content creators who require visually appealing charts and graphs for presentations, reports, and posts.
Unique Features
Chartgenie stands out for its user-friendly interface and the ability to create professional and beautiful charts quickly directly from an iPhone, without the need for extensive graphic design knowledge or software.
User Comments
Currently, there is no direct user feedback available to analyze.
Traction
Specific quantitative details regarding Chartgenie's user base, revenue, or other forms of traction were not found in the information provided or publicly available sources.
Market Size
The global data visualization market size is anticipated to reach $10.2 billion by 2026, growing at a CAGR of 9.2% from 2021 to 2026.

Chord - Multiplayer AI Chats
Chat with your team and LLMs in the same chat.
179
Problem
Users rely on separate tools for team collaboration (e.g., Slack) and AI interactions (e.g., ChatGPT), requiring them to switch between different platforms, leading to fragmented context, repeated copy-pasting, and inefficient workflows.
Solution
A multiplayer AI chat platform where teams and LLMs interact in shared chats. Users collaborate with teammates and AI models (like GPT-4) in real-time, with integrated context and chat history, eliminating manual data sharing.
Customers
Remote teams, product managers, developers, and data scientists needing collaborative AI workflows for tasks like brainstorming, coding, or decision-making.
Unique Features
Combines team chat and multi-LLM interactions in a single interface, supports shared context/history, and allows simultaneous human-AI collaboration without switching tabs.
User Comments
Saves time by reducing app switching
Enables seamless AI-powered teamwork
Eliminates manual context sharing
Improves decision-making with real-time AI input
Intuitive for cross-functional projects
Traction
Launched on ProductHunt (exact metrics unspecified), positioned in the growing AI collaboration tools market. Comparable products like Tangle (tangle.ai) report 50k+ users.
Market Size
The global $18.7 billion team collaboration software market (2022) is expanding with AI integration, projected to grow at 10%+ CAGR through 2030.

Notion Charts
Create beautiful charts for your Notion pages
139
Problem
Users struggle to integrate visually appealing and functional charts within their Notion pages. Traditional methods can be cumbersome, lacking in aesthetic value, and don't always allow for easy synchronization with a Notion database's data, leading to a disjointed experience and extra manual work in data management.
Solution
Notion Charts is a tool that enables users to create stunning charts directly in their Notion projects. Users can choose from a variety of chart types to suit their data visualization needs. Some tools within Notion Charts also allow for direct synchronization with a Notion database, ensuring that charts are always up-to-date with the latest data.
Customers
Data analysts, project managers, content creators, and educational users who use Notion for project management, data visualization, content organization, and educational material creation.
Alternatives
View all Notion Charts alternatives →
Unique Features
The ability to create visually appealing charts directly within Notion pages and the option for some tools to synchronize directly with Notion databases for up-to-date data visualizations.
User Comments
Users appreciate the ease of creating beautiful charts within Notion.
The synchronization feature with Notion databases is highly valued.
Some users wish for more types of charts and customization options.
The ability to integrate charts has streamlined many users' workflows.
Overall positive feedback regarding the tool's functionality and aesthetic qualities.
Traction
Although specific traction data such as number of users or revenue is not available, the positive feedback and user comments suggest growing interest and adoption among Notion users.
Market Size
Data not specifically available for Notion chart tools, but the global business intelligence and analytics software market, which includes data visualization tools, is projected to reach $17.6 billion by 2024.