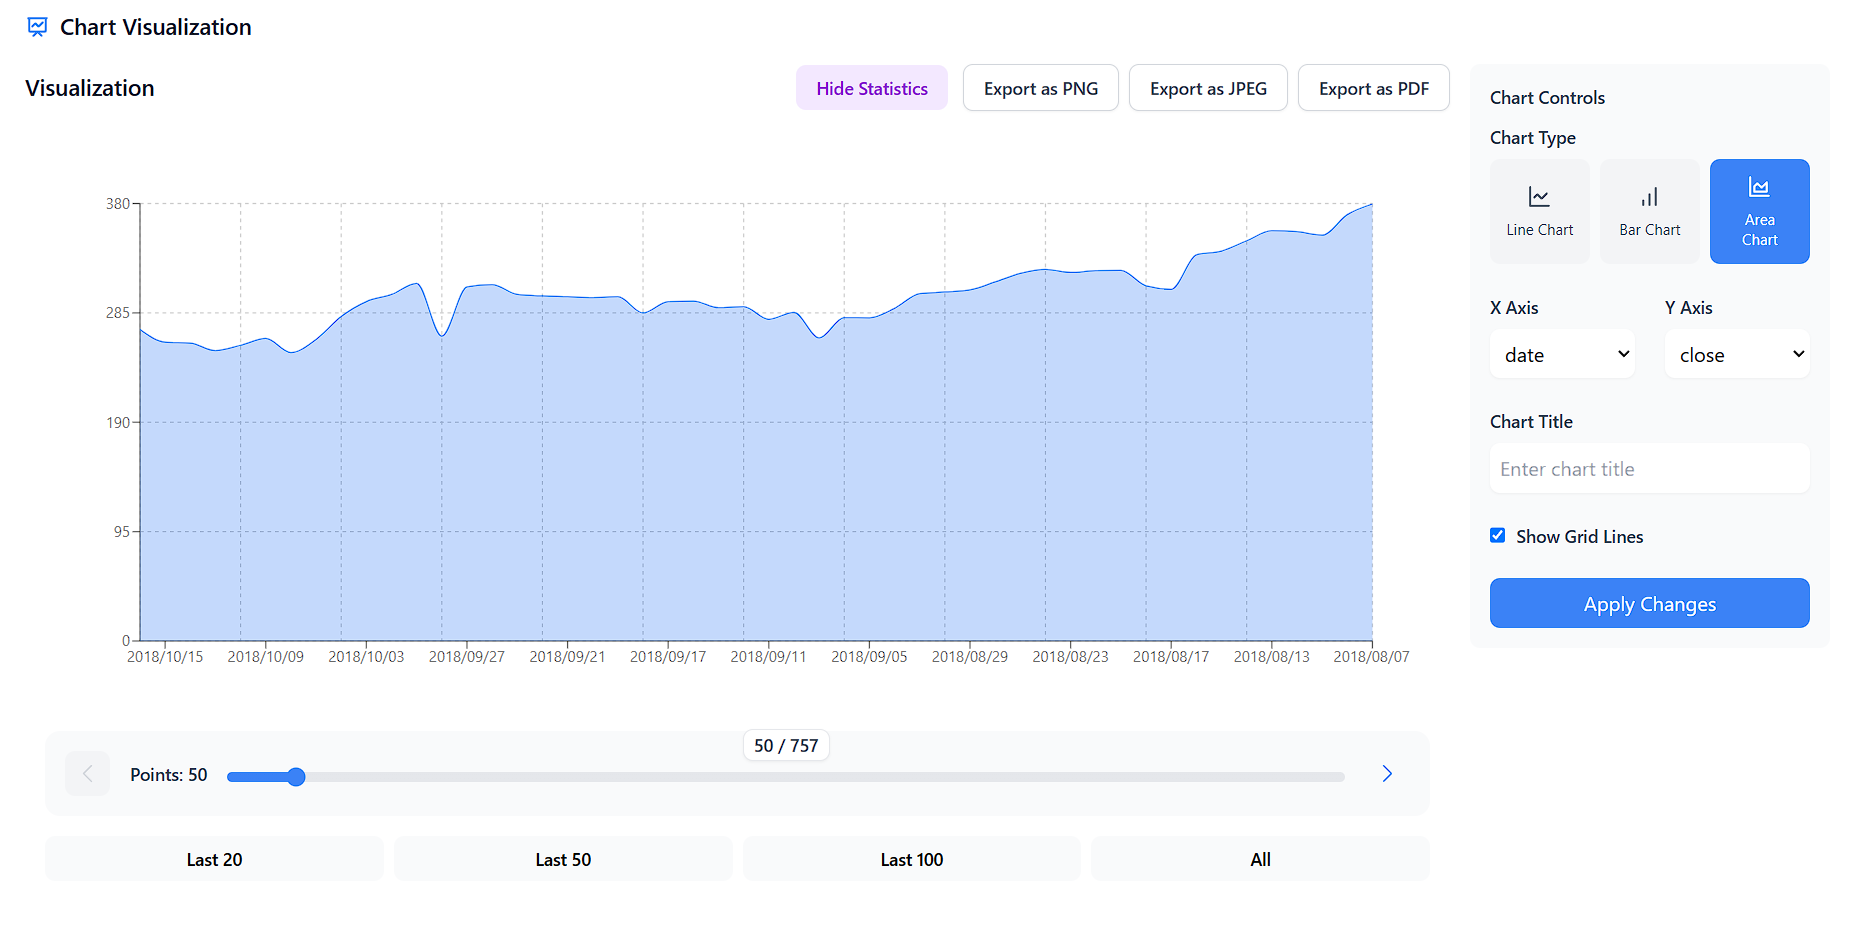
What is Online Data Analysis for Excel?
Visualizing and analyzing data manually can be time-consuming. This tool simplifies the process by automatically creating graphs from your uploaded data, making it easy to understand. It also benefits data science engineers and students.
Problem
The current situation involves users having to visualize and analyze data manually, which is often time-consuming and cumbersome. The drawbacks include the need to manually create graphs, which can lead to inefficiencies and potential errors.
Solution
The solution offered is a tool that automatically creates graphs from your uploaded data. Users can upload CSV, Excel, or JSON data to receive visualizations, making the data easier to understand.
Customers
Data science engineers and students looking to simplify and speed up the data visualization and analysis process.
Unique Features
The ability to upload CSV, Excel, and JSON data for automatic graph creation, streamlining the visualization process without manual intervention.
User Comments
The tool significantly saves time in data visualization.
User interface is intuitive and easy to navigate.
Some users wish for more customization options in the graphs.
It is particularly useful for those not well-versed in programming or data tools.
The product effectively meets the needs of students and professionals.
Traction
The product has gained visibility on Product Hunt but specific statistics on user numbers or revenue are not provided in the input information.
Market Size
The global data visualization market was valued at approximately $8.85 billion in 2021 and is projected to reach about $19.2 billion by 2026, indicating significant potential for products in this space.


