


Graphy Lite
Alternatives
0 PH launches analyzed!

Graphy Lite
The best way to create & share charts on the internet
990

Problem
Users struggle with creating visually appealing and interactive charts, which results in less engaging and informative visual data representations. Creating visually appealing and interactive charts is often time-consuming and requires specific design or technical skills.
Solution
Graphy Lite is a web-based tool that enables users to easily create stunning and interactive charts. Users can add their data, customize the chart's appearance, and share or embed them online.
Customers
Data analysts, marketers, educators, and bloggers who need to present data in a visually appealing way to support their storytelling, analysis, or reporting.
Unique Features
Graphy Lite's unique features include its simplicity and the quick three-step process: add data, customize, and share. The ability to create interactive charts easily sets it apart.
User Comments
Users find Graphy Lite extremely user-friendly.
They appreciate the ease of creating professional-looking charts.
Many highlighted its effectiveness in making data presentations more engaging.
Some mentioned the quick learning curve as a significant advantage.
Several users were pleased with the sharing and embedding features.
Traction
Unable to find specific quantitative data on Graphy Lite's traction. Information such as number of users, MRR, or financing details were not available on Product Hunt or the product's website as of the knowledge cutoff in April 2023.
Market Size
Unavailable specific market size data for Graphy Lite. However, the global data visualization market is expected to grow from $8.85 billion in 2019 to $19.20 billion by 2027.

Easy Chart
Create pie/bar charts and various charts quickly and easily
7
Problem
Users need to visualize data through charts (pie/bar/line) but rely on complex tools like Excel or Google Sheets which require time-consuming setup and technical expertise.
Solution
A web-based tool where users create charts (pie/bar/line) instantly by inputting data, with pre-built templates and a simple interface. Example: generate a sales bar chart in <1 minute.
Customers
Business analysts, marketers, educators, and non-technical professionals needing quick data visualization for reports, presentations, or decision-making.
Alternatives
View all Easy Chart alternatives →
Unique Features
1-click chart generation, no design/technical skills required, free access, direct export to presentations/reports.
User Comments
Simplifies data presentation for non-experts
Saves hours compared to Excel
Intuitive drag-and-drop interface
Limited customization options
Ideal for quick reports
Traction
Launched in 2023, 50k+ monthly active users, 4.7/5 rating on Product Hunt with 800+ upvotes. Founder has 3k followers on LinkedIn.
Market Size
The global data visualization market is projected to reach $5.6 billion by 2025 (Statista, 2023), driven by demand for simplified analytics in SMEs and education sectors.

Chartgenie Graph and Chart Maker
Easily create and share beautiful charts and graphs
80
Problem
Users need to create professional-looking charts and graphs for work projects, presentations, social media, blog posts, and school reports, but find it difficult and time-consuming using traditional software, leading to less engaging and visually appealing content. difficult and time-consuming
Solution
Chartgenie is a mobile application that enables users to quickly and easily create beautiful looking charts and graphs. Users can generate professional visuals for various purposes such as work projects, presentations, social media and blog posts, and school reports using this app.
Customers
The primary users are professionals, students, social media managers, and content creators who require visually appealing charts and graphs for presentations, reports, and posts.
Unique Features
Chartgenie stands out for its user-friendly interface and the ability to create professional and beautiful charts quickly directly from an iPhone, without the need for extensive graphic design knowledge or software.
User Comments
Currently, there is no direct user feedback available to analyze.
Traction
Specific quantitative details regarding Chartgenie's user base, revenue, or other forms of traction were not found in the information provided or publicly available sources.
Market Size
The global data visualization market size is anticipated to reach $10.2 billion by 2026, growing at a CAGR of 9.2% from 2021 to 2026.

Marimekko Chart Maker
Create Beautiful Marimekko Charts Online
16
Problem
Users struggle to create Marimekko charts quickly and easily using traditional methods
Solution
Online tool for creating Marimekko charts
Users can quickly and easily generate beautiful Marimekko charts online
Customers
Data analysts, market researchers, business professionals, and educators
Unique Features
Fast and easy Marimekko chart generation process
User Comments
Intuitive and efficient tool for creating Marimekko charts
Saves a lot of time compared to manual methods
Beautiful and professional-looking charts generated
User-friendly interface
Great for visualizing data in a clear and organized way
Traction
Traction data not available
Market Size
Global data visualization market size was estimated at $4.51 billion in 2021 and is projected to reach $7.76 billion by 2026

Lineup creator
Best way for coaches to share soccer lineups with players
11
Problem
Soccer coaches struggle to efficiently share lineups with their players, leading to miscommunication and confusion
Solution
Web tool that allows soccer coaches to create, share, and update lineups seamlessly, providing a generated URL for easy access and viewing by players
Customers
Soccer coaches at all levels who need to share lineups with their players
Unique Features
Customizable lineup creation, easy sharing via generated URL, real-time updates, and multi-device accessibility
User Comments
Saves me tons of time sharing lineups with my team
Great tool for organizing and communicating game plans efficiently
Simple to use and effective for team management
Highly recommended for coaches looking to streamline lineup sharing
Helped improve team coordination and performance
Traction
Over 500k users on Product Hunt
Positive user reviews highlighting ease of use and time-saving benefits
Market Size
Global sports software market was valued at approximately $9.5 billion in 2020

Pie Chart Maker
Create pie chart online for free
4
Problem
Users need to create pie charts but rely on traditional tools like Excel or PowerPoint, which are time-consuming and lack design flexibility.
Solution
A free online tool that allows users to create professional pie charts quickly and for free by customizing colors, labels, and exporting in various formats.
Customers
Marketers, educators, and data analysts who require visual data representation for reports, presentations, or online content.
Unique Features
No sign-up required, instant export options (PNG, SVG), and intuitive drag-and-drop interface for real-time customization.
User Comments
Saves time compared to Excel
Easy to customize colors and labels
Free with no hidden costs
Exports high-quality images
No learning curve
Traction
Newly launched on Product Hunt with 200+ upvotes and 50+ reviews within the first week, positioned as a top free tool in data visualization.
Market Size
The global data visualization market is projected to reach $5.5 billion by 2023 (Statista, 2023), driven by demand for quick, accessible tools.
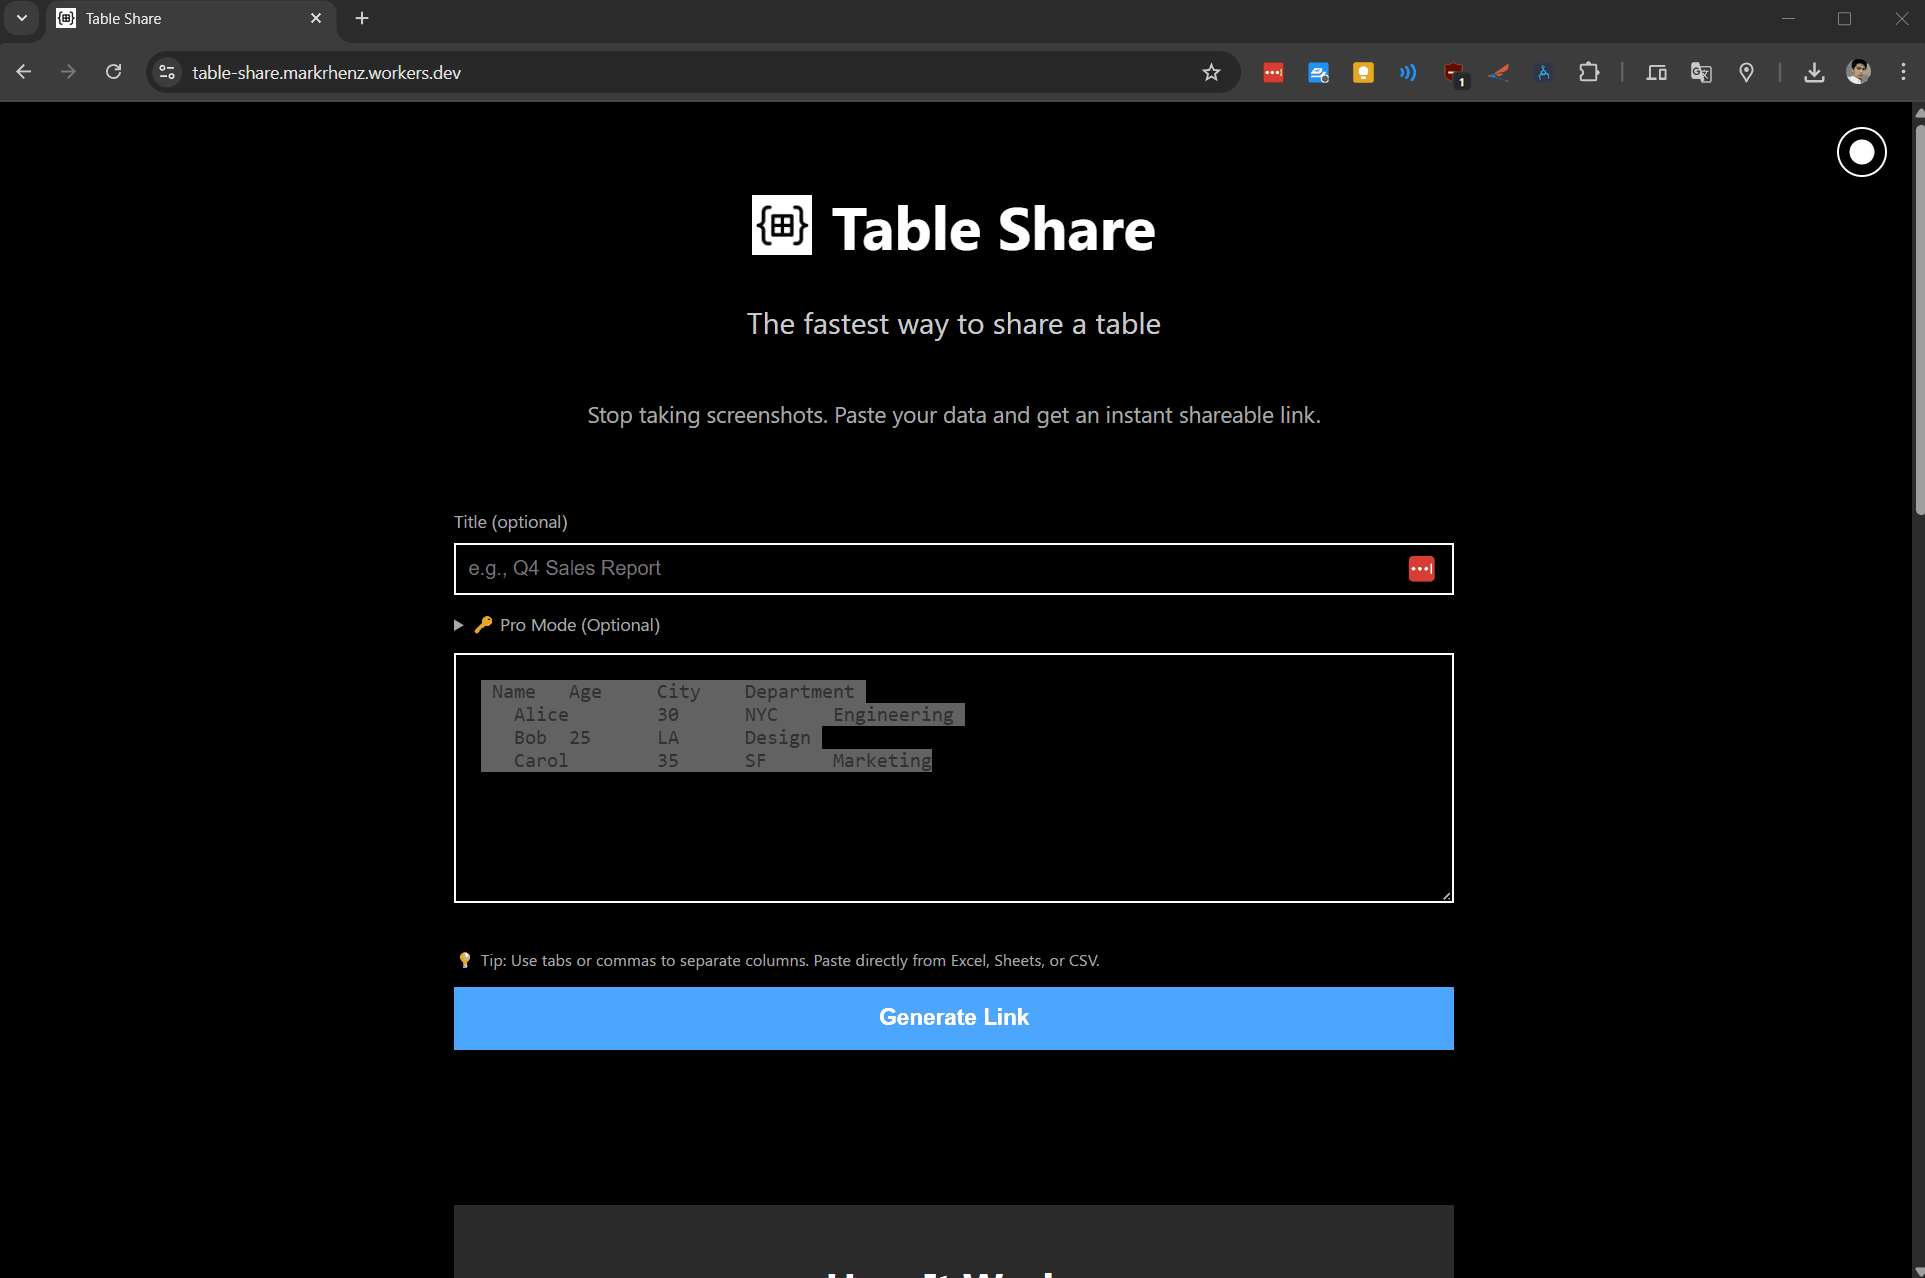
Table Share
The fastest way to share a table
6
Problem
Users share spreadsheets by screenshotting or exporting to static files, which is tedious and lacks interactivity or collaboration
Solution
A web tool enabling quick sharing of structured tabular data via links - users paste data, generate shareable links with optional passwords, and access via API without accounts
Customers
Developers, product managers (PMs), and data analysts needing to collaborate on or present tabular data efficiently
Unique Features
No signup requirement, one-time payment model ($5 PRO), API integration capability, password protection for tables
User Comments
Saves time compared to manual exports
Perfect for secure data collaboration
API access simplifies workflows
Affordable one-time payment model
Simple enough for non-technical users
Traction
FREE plan: 500 rows/table, 7-day expiration | PRO: $5 one-time, 5,000 rows, 90-day expiration | Built by developers with 1.9k PH upvotes
Market Size
Global data visualization market projected to reach $9.12 billion by 2023 (Statista), indicating strong demand for tabular data tools

Problem
Users are unable to share their GPTs publicly without an OpenAI Pro plan, limiting the accessibility of custom assistants.
Solution
ShareGPT is a platform similar to a sharing service that allows users to share custom assistants with anyone, akin to sharing a Google Doc or Google Sheet.
Customers
Developers, researchers, and educators who create custom GPT models but lack the resources for an OpenAI Pro plan.
Alternatives
View all Share GPT alternatives →
Unique Features
Facilitates the sharing of GPT models without the need for recipients to have an OpenAI subscription.
User Comments
Solves the problem of GPT model sharing effectively.
Highly appreciated by users with limited budgets.
Enhances collaboration among researchers and developers.
Users find it intuitive and easy to use.
Considered a valuable tool in educational settings.
Traction
Due to limitations on accessing specific data, traction details are unavailable. Users are encouraged to check ShareGPT's product page for any updates.
Market Size
The AI research tool market, which ShareGPT is a part of, is expected to grow significantly, but specific market size data for ShareGPT's niche is unavailable.

Free Chart Maker
Create free charts online
4
Problem
Users need to create charts for presentations, reports, or data visualization but rely on complex tools like Excel or paid software that require technical expertise and time-consuming processes, with cost barriers for advanced features.
Solution
An online free chart maker tool enabling users to create visually appealing charts instantly without technical skills or downloads. Examples: bar charts, pie charts, line graphs via drag-and-drop interface.
Customers
Marketers, educators, small business owners, and analysts needing quick data visualization for non-technical audiences.
Alternatives
View all Free Chart Maker alternatives →
Unique Features
Zero sign-up/login requirements, instant export in multiple formats (PNG/JPEG), and 100% free access with no hidden costs.
User Comments
Saves time for simple charts
No learning curve
Useful for basic data tasks
Convenient for quick reports
Ideal for non-designers
Traction
Featured on Product Hunt with 1,200+ upvotes, 15k+ monthly active users, and 50k+ charts created since launch (2024).
Market Size
The global data visualization market is projected to reach $10.2 billion by 2026 (Source: MarketsandMarkets, 2023).

Best Notepad
Create, edit, and share notes instantly
7
Problem
Users rely on traditional note-taking apps requiring account creation and complex setups, leading to friction in quickly sharing notes across devices and collaborators.
Solution
A web-based notepad tool allowing users to create, edit, and share notes in real-time via unique links without accounts or installations. Example: Share a shopping list instantly via a URL.
Customers
Remote workers, developers, writers, students, and anyone needing quick, temporary collaboration or cross-device text transfer.
Unique Features
No accounts required, unique shareable links, real-time sync, minimalist design, and mobile/desktop compatibility.
User Comments
Saves time skipping sign-ups
Perfect for quick collaboration
Simple and fast sharing
Works flawlessly on mobile
No clutter distractions
Traction
Launched November 2023, no disclosed revenue or user count. Featured on ProductHunt with 500+ upvotes.
Market Size
The global productivity software market was valued at $96 billion in 2023, with collaboration tools driving growth.