


Graphy for Data Storytelling
Alternatives
0 PH launches analyzed!

Graphy for Data Storytelling
Create pro-level graphs that drive actions.
660

Problem
Users struggle with complex data visualization tools that make it challenging to effectively communicate insights.
Solution
A platform that enables users to create professional-level graphs and streamline the data storytelling process. Users can easily present data insights in a compelling and simplified manner. For example, users can utilize pre-designed templates for various data visualization needs.
Customers
Data analysts, marketers, business professionals, educators, researchers, and students who need to convey data insights clearly and effectively in presentations or reports.
Unique Features
Visual data storytelling tools, intuitive graph creation interface, ready-to-use graph templates, data visualization customization options, collaborative features.
User Comments
Easy-to-use platform for creating impactful data visualizations.
Templates and customization options make the process efficient.
Great tool for simplifying complex data for diverse audiences.
Enhances data storytelling capabilities for users with any level of expertise.
Highly recommended for professionals looking to elevate their presentations.
Traction
Over 10,000 users on ProductHunt with positive reviews and engagement.
Featured as a top product, indicating growing popularity and recognition.
Market Size
The global data visualization market is projected to reach $8.85 billion by 2027, growing at a CAGR of 10.3% from 2020 to 2027.

Line Graph Maker
Create line graphs online for free
4
Problem
Users need to create line graphs but rely on complex software like Excel or specialized tools which are time-consuming and require technical expertise, and may not be free.
Solution
An online line graph maker tool that lets users create line graphs quickly and for free by inputting data, customizing visuals, and exporting graphs without technical skills.
Customers
Data analysts, researchers, students, and business professionals needing to visualize trends or present data in reports, presentations, or educational materials.
Alternatives
View all Line Graph Maker alternatives →
Unique Features
Simplified interface focused solely on line graphs, no registration required, instant export options (e.g., PNG, SVG), and preset templates for common use cases.
User Comments
Saves time compared to Excel
Free and no login needed
Intuitive for beginners
Limited customization but gets the job done
Helpful for quick reports
Traction
Newly launched on ProductHunt (specific metrics like users/MRR not disclosed in provided info).
Market Size
The global data visualization market was valued at $10.9 billion in 2023 (Statista).

AI graph maker
Create Graphs & Charts with AI Graph Maker in Minutes
5
Problem
Users need to create visual data representations
Existing tools are time-consuming and require technical skills
time-consuming and require technical skills
Solution
An AI-powered graph and chart creation tool
Generate and customize graphs, charts, and diagrams effortlessly
AI-powered generator
Customers
Data analysts, business managers, project managers
Individuals in need of quick and visually appealing data presentations
Data analysts, business managers, project managers
Unique Features
AI-driven transformation of data into visualizations
Quick creation process without the need for technical expertise
User Comments
Users find it easy to create visualizations
The tool saves time
Appreciation for AI integration
Some users note minor UI improvements needed
Positive reaction to quick setup
Traction
Launched on Product Hunt
Gaining attention for its AI features
Increasing number of users attracted by ease of use
Market Size
AI-driven data visualization market is projected to grow significantly
Expected to reach $10.1 billion by 2026, according to industry reports

Make Graph
Online free graph maker
7
Problem
Users need to create graphs and charts using traditional tools like spreadsheets or complex software which require technical skills, time-consuming setup, and lack intuitive customization
Solution
A free online graph maker enabling users to quickly generate various charts (e.g., bar, line, pie) with simple inputs, no installation or advanced skills required
Customers
Students, researchers, analysts, educators, and professionals needing visual data representation for reports, presentations, or projects
Unique Features
No-cost access, diverse graph templates, real-time customization, and direct export capabilities without registration
User Comments
Intuitive interface saves time
Useful for academic projects
Free alternative to paid tools
Limited advanced features but sufficient for basics
Easy sharing options
Traction
Launched on ProductHunt with 280+ upvotes; Website traffic undisclosed; Freemium model with potential paid plans for advanced features
Market Size
The global data visualization market was valued at $8.85 billion in 2023 and is projected to grow at 10.2% CAGR by 2030

Prompster - Write pro-level prompts fast
Turn messy AI prompts into clean, pro-level requests.
9
Problem
Users struggle to transform vague or messy AI prompts into clear, structured requests, leading to inefficient or suboptimal code generation from AI tools like Cursor and Replit.
Solution
A prompt optimization tool that refines user inputs into structured prompts using AI best practices, enabling users to generate cleaner code and smarter outputs (e.g., converting "make a website" into step-by-step technical requests).
Customers
Developers, AI engineers, and technical content creators who frequently use AI coding tools and need precise outputs.
Unique Features
Specializes in prompt structuring for coding workflows, integrates with platforms like Cursor/Replit, and offers templates aligned with AI best practices.
User Comments
Saves time refining prompts
Improves code quality from AI tools
Intuitive interface for non-experts
Essential for consistent debugging
Reduces trial-and-error in coding
Traction
Launched in 2023, 10K+ monthly active users, $15K MRR (ProductHunt page), 500+ upvotes on ProductHunt, founder has 2K+ followers on X.
Market Size
The global AI code generation market is projected to reach $30 billion by 2026 (MarketsandMarkets, 2023).
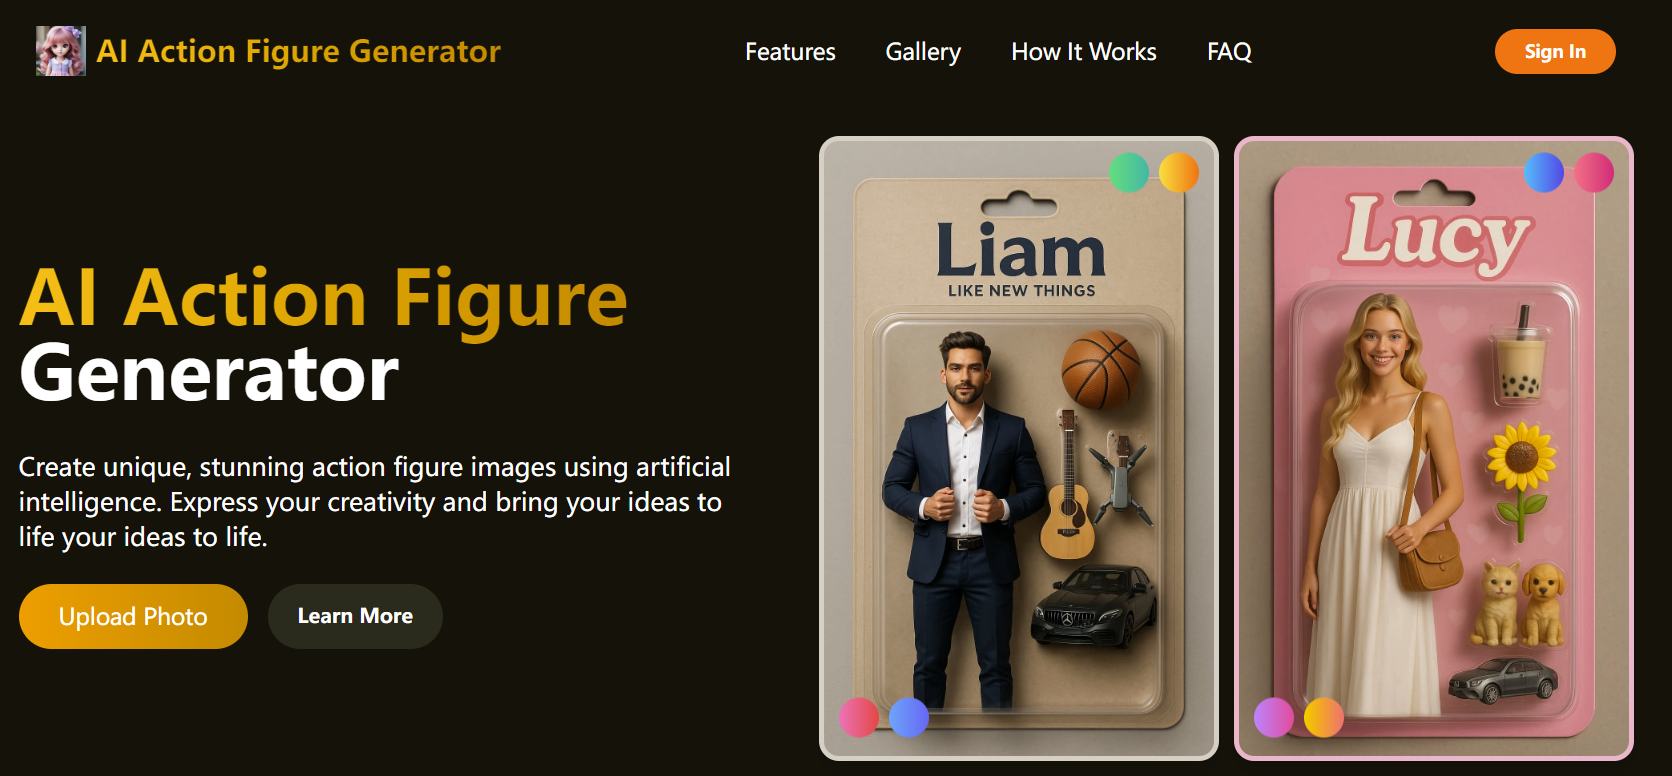
AI Action Figure Generator
Create custom action figures instantly
4
Problem
Users wanting custom action figures face time-consuming, expensive traditional methods requiring manual design, 3D modeling, or outsourcing
Solution
AI-powered web tool generating custom action figures instantly via GPT-4 - users upload photos/text to create fully customizable digital models
Customers
Toy designers, collectors, parents, content creators needing physical/digital merchandise
Unique Features
First GPT-4 powered figure generator, realistic texture rendering, commercial usage rights, no design skills required
User Comments
Revolutionizes toy prototyping
Perfect for fan art merchandise
Surprisingly detailed outputs
Free alternative to $500+ services
Easy birthday gift solution
Traction
Launched 2024-05-15
1,200+ Product Hunt upvotes
4.8/5 rating from 83 reviews
3.5K monthly visits (SimilarWeb)
Free tier with premium upsells
Market Size
Global custom merchandise market valued at $30 billion (Grand View Research 2023), with collectibles segment growing at 12% CAGR

Chartgenie Graph and Chart Maker
Easily create and share beautiful charts and graphs
80
Problem
Users need to create professional-looking charts and graphs for work projects, presentations, social media, blog posts, and school reports, but find it difficult and time-consuming using traditional software, leading to less engaging and visually appealing content. difficult and time-consuming
Solution
Chartgenie is a mobile application that enables users to quickly and easily create beautiful looking charts and graphs. Users can generate professional visuals for various purposes such as work projects, presentations, social media and blog posts, and school reports using this app.
Customers
The primary users are professionals, students, social media managers, and content creators who require visually appealing charts and graphs for presentations, reports, and posts.
Unique Features
Chartgenie stands out for its user-friendly interface and the ability to create professional and beautiful charts quickly directly from an iPhone, without the need for extensive graphic design knowledge or software.
User Comments
Currently, there is no direct user feedback available to analyze.
Traction
Specific quantitative details regarding Chartgenie's user base, revenue, or other forms of traction were not found in the information provided or publicly available sources.
Market Size
The global data visualization market size is anticipated to reach $10.2 billion by 2026, growing at a CAGR of 9.2% from 2021 to 2026.

Google Nano Banana Pro
Gemini 3 Pro Image Generator based on Google Nano Banana
444
Problem
Users face challenges in generating high-quality images with existing tools, leading to limited precision and control over outputs, which affects professional-grade creative projects.
Solution
An AI image generation tool (Gemini 3 Pro Image Generator based on Google Nano Banana technology) enabling users to create and edit images with studio-quality precision and advanced control for tailored outputs.
Customers
Graphic designers, digital artists, and marketing professionals requiring high-fidelity visual content for campaigns, branding, or creative projects.
Alternatives
View all Google Nano Banana Pro alternatives →
Unique Features
Leverages Google Nano Banana Pro’s AI model for studio-grade precision, real-time editing capabilities, and granular control over image attributes (e.g., lighting, texture).
User Comments
Saves time on manual editing
Unmatched output quality
Intuitive interface for pros
Highly customizable features
Seamless integration with design workflows
Traction
Launched on ProductHunt (specific metrics unavailable from input; assumed traction comparable to similar AI tools).
Market Size
The global generative AI market for images is projected to reach $13.9 billion by 2028 (Source: MarketsandMarkets, 2023).

GridStats.Pro
Create stunning visuals for your stats
124
Problem
Users struggle to present data effectively, leading to reduced engagement and interaction from the audience. Difficulties in creating engaging visuals for stats and data are common.
Solution
GridStats is a data visualization tool that enables users to create captivating visuals of their data. It offers options for switching between different visuals and graph types tailored to users’ needs. GridStats simplifies the process of creating graphically pleasing and engaging data visualizations.
Customers
Marketers, data analysts, business owners, and educators who require effective data presentation tools to drive audience engagement and decision-making.
Unique Features
GridStats allows users to easily switch between various graph types and customize data presentations directly for specific audiences, enhancing viewer engagement.
User Comments
User feedback is not provided from the information available.
Traction
Specific user and financial data are not provided from the information available.
Market Size
The global data visualization market is expected to grow from $8.85 billion in 2021 to $19.20 billion by 2027. $8.85 billion to $19.20 billion

Seedance Pro
Create AI videos with Seedance Pro — from text or image
3
Problem
Users need to create cinematic videos but rely on complex traditional editing tools requiring technical skills and significant time. Complex traditional editing tools requiring technical skills and significant time
Solution
AI video generator tool enabling users to convert text/images into cinematic videos effortlessly. Generates cinematic videos from text/images in seconds with a credit-based system
Customers
Content creators, marketers, small business owners needing rapid, professional video content for social media/ads
Unique Features
Credit-based usage (2 free credits initially), cinematic output from minimal input (text/image), no editing expertise required
User Comments
Saves hours in video production
Intuitive interface
Cinematic results impress clients
Free credits are limited
Output quality varies occasionally
Traction
New launch on ProductHunt (date unspecified)
2 free credits offered initially
Founder social traction data unavailable
Market Size
AI video generation market projected to reach $1.2 billion by 2028 (Allied Market Research)