What is GridStats.Pro?
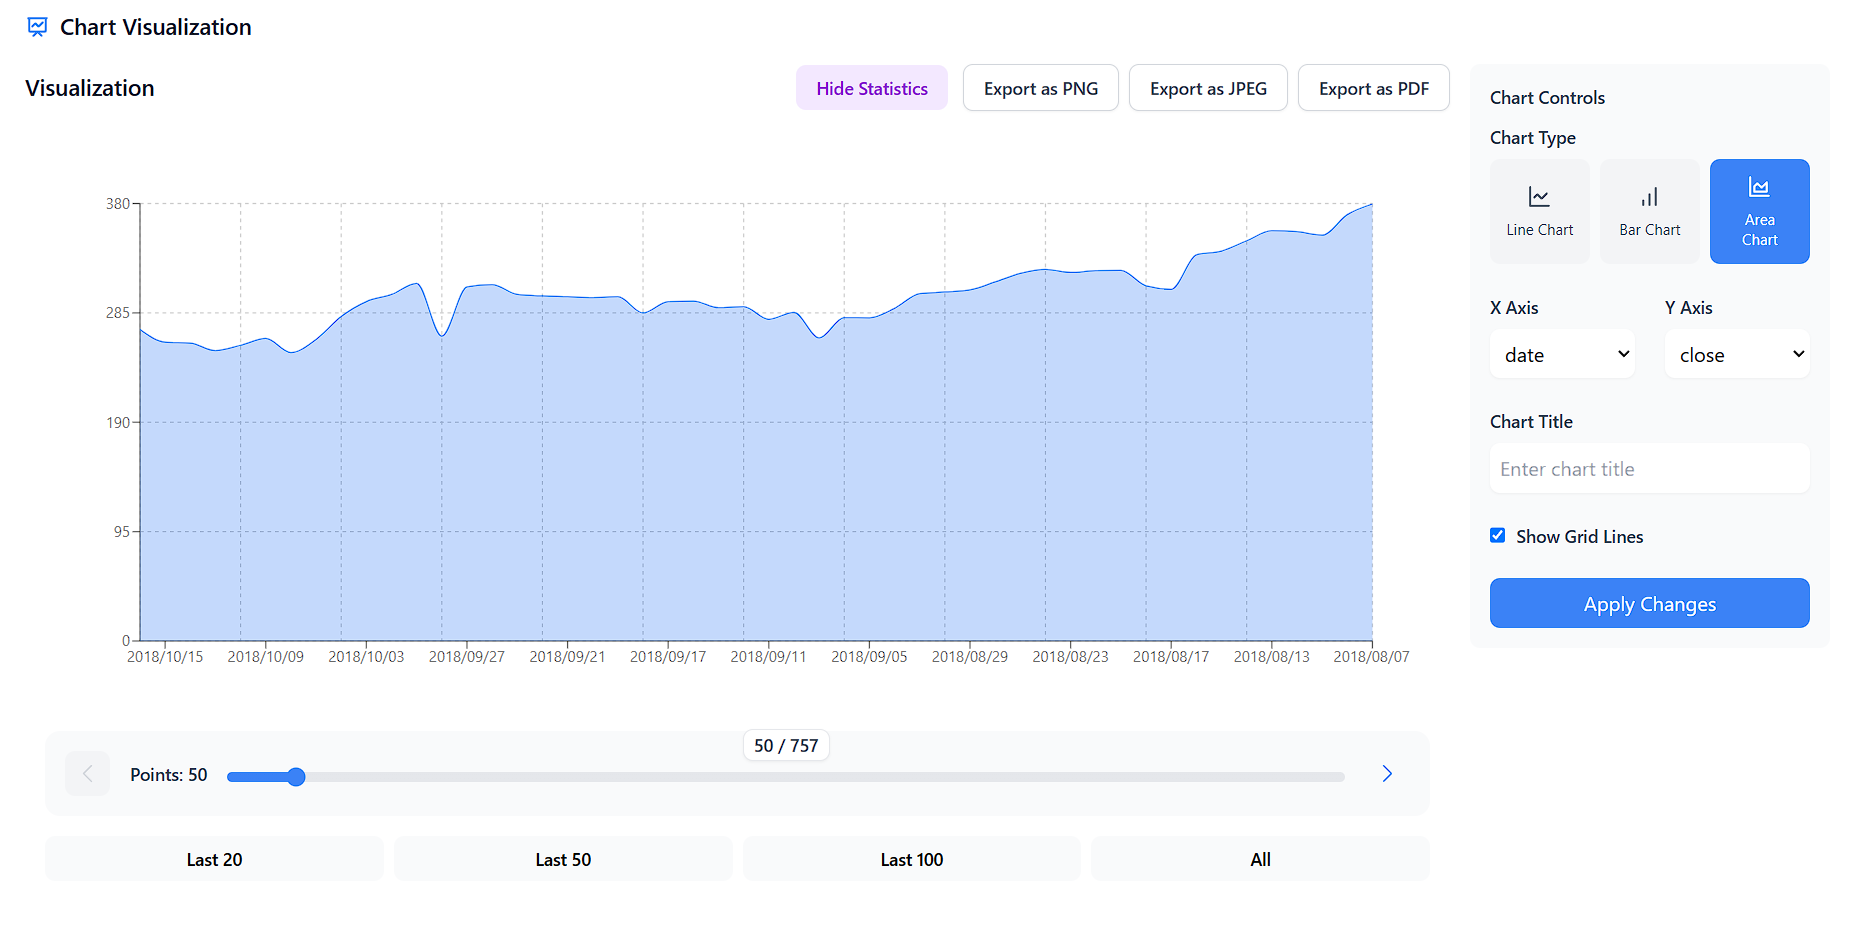
GridStats is the easiest way to create engaging visuals displaying your data or stats. It allows you to change between different visuals, graph types, and change your data to accommodate for your audience and drive engagement and interaction.
Problem
Users struggle to present data effectively, leading to reduced engagement and interaction from the audience. Difficulties in creating engaging visuals for stats and data are common.
Solution
GridStats is a data visualization tool that enables users to create captivating visuals of their data. It offers options for switching between different visuals and graph types tailored to users’ needs. GridStats simplifies the process of creating graphically pleasing and engaging data visualizations.
Customers
Marketers, data analysts, business owners, and educators who require effective data presentation tools to drive audience engagement and decision-making.
Unique Features
GridStats allows users to easily switch between various graph types and customize data presentations directly for specific audiences, enhancing viewer engagement.
User Comments
User feedback is not provided from the information available.
Traction
Specific user and financial data are not provided from the information available.
Market Size
The global data visualization market is expected to grow from $8.85 billion in 2021 to $19.20 billion by 2027. $8.85 billion to $19.20 billion


