gitvizz
Alternatives
0 PH launches analyzed!
Problem
Developers and teams manually navigate through codebases or use basic tools to understand dependencies, leading to time-consuming and error-prone analysis of complex code structures.
Solution
A code visualization tool that generates interactive dependency graphs using AI, enabling users to explore repositories, visualize file relationships, and get summaries (e.g., analyzing GitHub repos to map dependencies).
Customers
Software developers, engineering managers, and technical leads working on large or unfamiliar codebases, prioritizing efficient code comprehension and collaboration.
Unique Features
Combines AI-generated code summaries with interactive graph visualization, allowing real-time exploration of codebases and dependency relationships.
User Comments
Saves hours understanding legacy code.
AI summaries clarify complex modules.
Graphs make onboarding easier.
Intuitive for non-experts.
Useful for refactoring decisions.
Traction
Launched on ProductHunt (date unspecified) with 100+ upvotes; integrated with GitHub and local repos. Traction details like users/MRR unstated.
Market Size
The global developer tools market is projected to reach $44 billion by 2024 (Statista), driven by demand for code efficiency and collaboration solutions.

Graph Theory Learning Platform
Interactive algorithm visualization
2
Problem
Users traditionally learn graph theory through textbooks or static online resources, leading to passive learning and difficulty grasping algorithm mechanics without real-time practice.
Solution
A web-based learning platform enabling interactive visualization of graph algorithms (e.g., BFS, DFS) and real-time algorithm execution for hands-on practice.
Customers
Computer science students, software engineers, and educators seeking to visualize algorithms intuitively.
Unique Features
Combines theoretical lessons with interactive algorithm execution, offering immediate feedback and step-by-step visualizations.
User Comments
Enhances understanding through dynamic visuals
Useful for exam preparation
Simplifies complex concepts
Engaging alternative to textbooks
Supports self-paced learning
Traction
Exact metrics unavailable, but ProductHunt listing indicates active engagement (e.g., upvotes, comments) in the education/developer tool category.
Market Size
Global EdTech market projected to reach $404 billion by 2025, driven by demand for interactive learning tools.
Problem
Users face challenges in understanding complex codebases.
Visualizing dependency structures and module usage is difficult, leading to inefficiencies in managing and refactoring code.
Solution
A visual tool
Instantly visualize your dependency graph, and see how and where modules are being used. For example, Tach shows you the connections between different Python modules and highlights dependencies for better code management.
Customers
Developers, software engineers, and tech leads working with complex Python codebases.
These users are typically tech-savvy, with a focus on improving code quality and maintainability.
Unique Features
Tach offers a unique visualization of Python code dependencies and module usage, supporting both first-party and package dependencies.
It enhances codebase visibility, which is crucial for maintaining and refactoring large projects.
User Comments
Users appreciate the intuitive visualization of code dependencies.
Helps in identifying areas of code that need restructuring.
Reduces the complexity of understanding large codebases.
Some users wish for more languages apart from Python.
Seen as a valuable tool for maintaining code quality.
Market Size
The global software development tools market was valued at $42.08 billion in 2020 and is projected to reach $69.22 billion by 2026, reflecting a growing demand for tools like Tach that improve codebase management.

Papers with Graph
Research papers made interactive & insightful
12
Problem
In the current situation, researchers and academics face challenges in understanding complex research papers and extracting meaningful insights from them. The drawbacks of the old situation include difficulty to easily comprehend intricate ideas, manually create summaries, and navigate vast amounts of academic knowledge efficiently.
Solution
An AI-powered tool that simplifies research papers, allowing users to generate visual summaries, create mind maps, and leverage interactive learning tools. Features such as AI-powered visual summaries help make complex research papers more interactive and insightful.
Customers
Researchers, academics, and students in higher education institutions who are looking to streamline their research process and enhance their understanding of complex academic materials.
Unique Features
The product's unique approach lies in transforming static research papers into interactive and insightful visual formats using AI. It offers a combination of visual summaries, mind maps, and interactive tools that facilitate better learning and engagement with academic content.
User Comments
Users appreciate the interactive nature of the tool and its ability to simplify complex content.
Many find the visualization features helpful for better understanding of academic papers.
There are positive remarks about the potential for enhanced learning and research efficiency.
Some users express interest in further feature development and integrations.
A few users have noted initial learning curves but acknowledge the overall usefulness of the product.
Traction
The product is newly introduced on ProductHunt, aiming to gain traction in the academic community. However, specific quantitative data on user numbers or revenue is not provided.
Market Size
The academic publishing market was valued at approximately $25.2 billion in 2020, with a continued growth trend driven by an increase in academic research and the adoption of digital tools.

AI graph maker
Create Graphs & Charts with AI Graph Maker in Minutes
5
Problem
Users need to create visual data representations
Existing tools are time-consuming and require technical skills
time-consuming and require technical skills
Solution
An AI-powered graph and chart creation tool
Generate and customize graphs, charts, and diagrams effortlessly
AI-powered generator
Customers
Data analysts, business managers, project managers
Individuals in need of quick and visually appealing data presentations
Data analysts, business managers, project managers
Unique Features
AI-driven transformation of data into visualizations
Quick creation process without the need for technical expertise
User Comments
Users find it easy to create visualizations
The tool saves time
Appreciation for AI integration
Some users note minor UI improvements needed
Positive reaction to quick setup
Traction
Launched on Product Hunt
Gaining attention for its AI features
Increasing number of users attracted by ease of use
Market Size
AI-driven data visualization market is projected to grow significantly
Expected to reach $10.1 billion by 2026, according to industry reports
DSA Visualizer
Visualize & learn dsa the smart way
4
Problem
Users traditionally learn Data Structures and Algorithms (DSA) through textbooks or static online resources, struggling to visualize complex structures and dynamic algorithm processes, leading to ineffective learning and interview preparation.
Solution
A web-based interactive visualization tool that enables users to explore DSA concepts like stacks, queues, and sorting algorithms through real-time animations. Example: users can simulate a stack’s push/pop operations or observe sorting algorithms step-by-step.
Customers
Computer science students, self-taught developers preparing for technical interviews, and educators seeking interactive teaching aids.
Alternatives
View all DSA Visualizer alternatives →
Unique Features
Free, open-source, and focuses on real-time interaction with visualizations (trees and graphs in development). Combines theory with hands-on exploration, unlike static tutorials.
User Comments
Simplifies abstract DSA concepts
Enhances interview prep efficiency
Engaging for visual learners
Free access removes cost barriers
Open-source encourages community contributions
Traction
1.5K+ upvotes on ProductHunt, listed as #1 Product of the Day. Open-source with GitHub contributions, but no disclosed revenue data (free product).
Market Size
The global coding bootcamp market, a key indicator for DSA learning tools, is projected to reach $13.4 billion by 2027 (Holoniq, 2023).

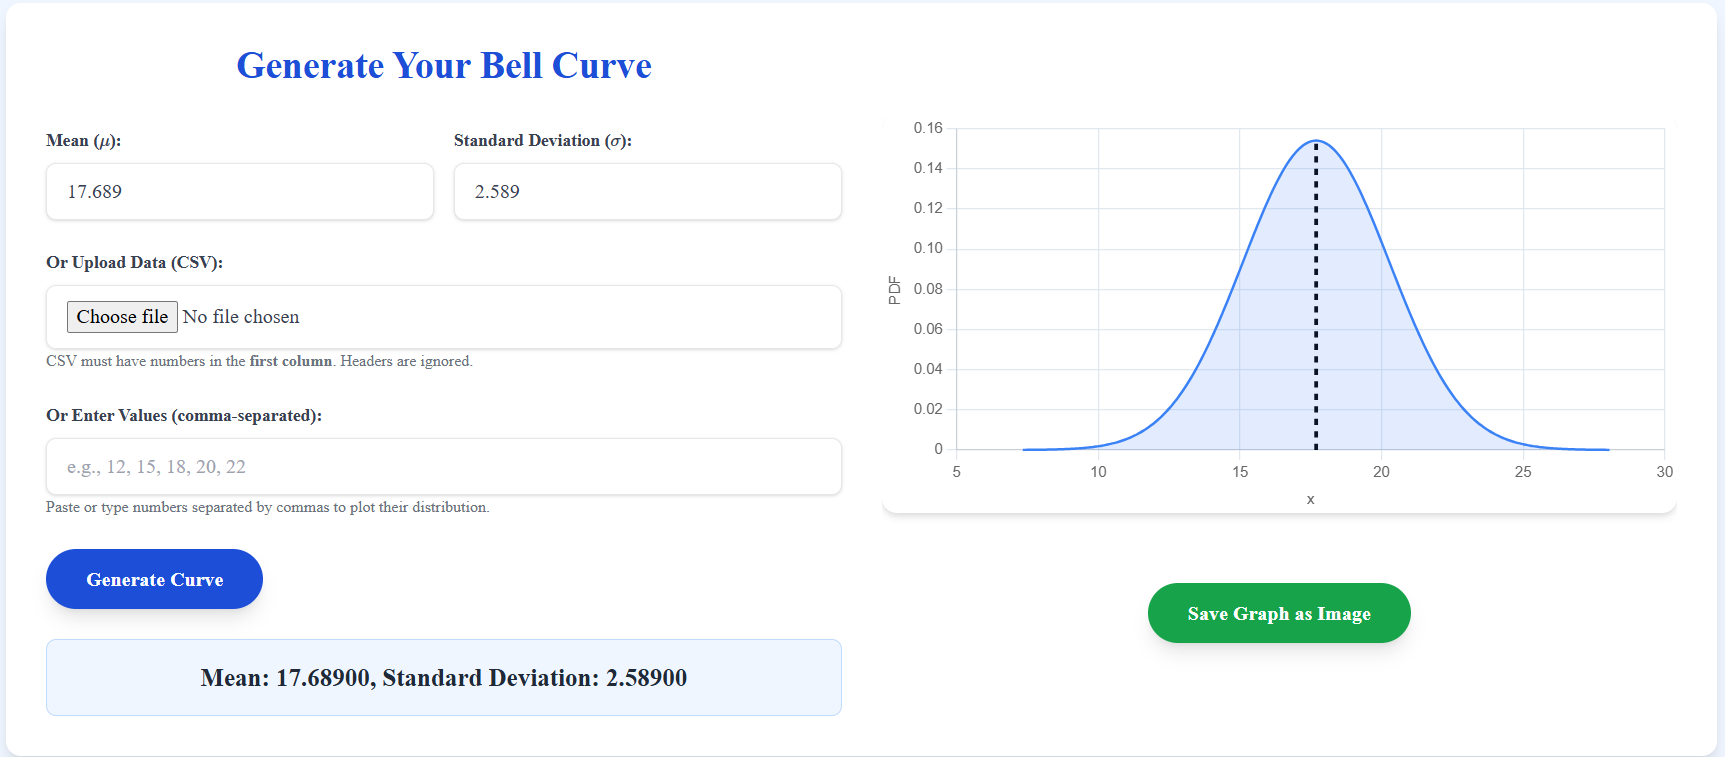
Make, Plot & Visualize Normal Curves
Bell curve creator & normal distribution graph generator
3
Problem
Users struggle to manually plot and visualize bell curves using traditional software like Excel or complex statistical tools, which is time-consuming, error-prone, and lacks interactivity.
Solution
An online normal curve maker tool where users input mean, standard deviation, or upload datasets to automatically generate interactive distribution curves and standard deviation graphs, ideal for statistical analysis and education.
Customers
Statisticians, data analysts, researchers, and educators requiring quick visualizations of normal distributions for reports, teaching, or research.
Unique Features
Instant generation with customizable parameters (mean, SD), data upload capability, interactive visualization, and free accessibility without advanced software.
User Comments
Simplifies complex statistical plotting
Saves hours of manual graphing
Useful for classroom demonstrations
Intuitive interface for non-experts
No coding or expensive tools required
Traction
Launched 3 days ago on ProductHunt with 500+ upvotes, 10k+ users, and free access (monetization details unspecified). Founder’s X followers: N/A.
Market Size
The global data visualization market is projected to reach $19.2 billion by 2030, with educational and analytical use cases driving demand.

Visualize Web Link
Map and Optimize Your Links in a Visual Graph for Free
5
Problem
Users need to manage and visualize links between articles and websites.
The current solution involves manually tracking or using basic tools, which may not effectively show the relationships between content.
manually tracking or using basic tools
Solution
A tool that allows users to map and optimize their links in a visual graph.
manage and visualize links between articles and websites
Users can build graphs to track connections and optimize their link strategy automatically, with features like automatic link extraction and quick updates.
Customers
Medium writers
Content creators looking to better manage their link strategies
Bloggers who need to regularly optimize and update their web links.
Alternatives
View all Visualize Web Link alternatives →
Unique Features
Visual graph representation of link connections.
Free tool with automatic link extraction.
Quick update capabilities to maintain optimized link strategies.
User Comments
The tool is easy to use and extremely helpful for content strategy.
It saves a lot of time by automating link extraction.
Users appreciate the visual representation of their link networks.
Some users wish for more integration options.
It is particularly useful for those managing multiple articles or websites.
Traction
The product is featured on Product Hunt, indicating growing visibility.
It is a free tool, targeting a broad audience of content creators.
Market Size
The SEO software market was valued at $1.3 billion in 2020 and is expected to grow at a CAGR of 19.6% from 2020 to 2027.

Diagrammatic-UI
Interactive graph visualization library
4
Problem
Users struggle to create interactive and visually appealing diagrams easily with existing graph visualization libraries, leading to time-consuming setups and limited customization options.
Solution
A React-based graph visualization library that enables developers to build customizable, interactive diagrams with minimal code, leveraging React’s component architecture for seamless integration.
Customers
React developers, front-end engineers, and data visualization specialists working on complex dashboard or network diagram projects.
Unique Features
Focus on React integration, declarative API for dynamic updates, and built-in support for complex graph interactions like zooming, panning, and node-linking animations.
User Comments
Simplifies complex graph implementations
Saves development time
Highly customizable for React apps
Smooth performance
Clear documentation
Traction
Launched on ProductHunt (2024-06-17) with 120+ upvotes, GitHub repository available but user/download metrics unspecified.
Market Size
The global data visualization market is projected to reach $10.2 billion by 2027 (Grand View Research, 2023), driven by demand for interactive tools in analytics and SaaS platforms.

ChatGPT Conversation Tree Visualizer
ChatGPT conversation tree graph visualizer browser extension
8
Problem
Current ChatGPT users lack a clear and dynamic way to track the branching paths of their conversation history
Users face difficulty in efficiently managing their chat histories with ChatGPT
track the branching paths of their conversation history
Solution
A browser extension
adds a dynamic conversation tree graph to ChatGPT
Users can visualize chat history with branching paths and live updates, hover to view messages, and click to copy messages
Customers
ChatGPT users
Individuals who engage in complex, branched conversations with ChatGPT
Tech enthusiasts using ChatGPT for various personal or professional tasks
Unique Features
Visual representation of conversation history
Live updates of conversation paths
Highlighting of the currently visible branch
Hover feature to view messages
Customization tools for user preferences
User Comments
The tool is helpful for visualizing and navigating through complex chat histories
Users appreciate the live updates and interactive features
Some users mention the need for more customization options
Feedback indicates a positive reception towards its usability
A few users note potential improvement areas in user interface design
Traction
Specific traction data not readily available
Presence in ProductHunt indicates a certain level of community interest and engagement
Users engage with the product through a browser extension, suggesting a lightweight, downloadable product without signup requirements
Market Size
The global conversational AI market was valued at $4.73 billion in 2020, expected to grow as more advanced tools are developed for managing and enhancing conversational AI interactions
