


Graph Theory Learning Platform
Alternatives
0 PH launches analyzed!

Graph Theory Learning Platform
Interactive algorithm visualization
2

Problem
Users traditionally learn graph theory through textbooks or static online resources, leading to passive learning and difficulty grasping algorithm mechanics without real-time practice.
Solution
A web-based learning platform enabling interactive visualization of graph algorithms (e.g., BFS, DFS) and real-time algorithm execution for hands-on practice.
Customers
Computer science students, software engineers, and educators seeking to visualize algorithms intuitively.
Unique Features
Combines theoretical lessons with interactive algorithm execution, offering immediate feedback and step-by-step visualizations.
User Comments
Enhances understanding through dynamic visuals
Useful for exam preparation
Simplifies complex concepts
Engaging alternative to textbooks
Supports self-paced learning
Traction
Exact metrics unavailable, but ProductHunt listing indicates active engagement (e.g., upvotes, comments) in the education/developer tool category.
Market Size
Global EdTech market projected to reach $404 billion by 2025, driven by demand for interactive learning tools.

Algorithm Visualizer Suite
Visualize, learn and explore algorithms
7
Problem
Users typically struggle to understand and visualize complex algorithms, making learning and exploration challenging and less intuitive.
Solution
A web-based Algorithm Visualizer Suite that allows users to explore various algorithms in real-time, covering sorting, pathfinding, graph traversal, tree operations, dynamic programming, and heap algorithms.
Users can learn and visualize algorithms with ease, enhancing their understanding and knowledge in a practical and interactive manner.
Customers
Students, teachers, computer science enthusiasts, and professionals in the tech industry.
Unique Features
Real-time visualization of algorithms across different categories, making learning interactive and engaging.
Covers a wide range of algorithms, providing a comprehensive platform for exploring various algorithmic concepts.
User Comments
Engaging platform for learning and visualizing algorithms.
Intuitive and easy-to-use interface.
Great tool for both beginners and experienced programmers.
Helpful for academic purposes and personal projects.
Enhances understanding of complex algorithms.
Traction
Gaining popularity with positive user feedback and increasing engagement.
Growing user base with high retention rates.
Continuous development and updates to enhance user experience.
Market Size
The global e-learning market size was valued at approximately $250 billion in 2020, with a projected growth rate of around 8% from 2021 to 2027.

Map Pathfinding Visualizer
Pathfinding visualizer on a real map, anywhere in the world
53
Problem
Users struggle to visualize how common pathfinding algorithms function on real-world streets. Traditional pathfinding tools do not illustrate the algorithms' behavior or efficiency on actual maps.
Solution
A website that offers a pathfinding visualizer, allowing users to see how common pathfinding algorithms behave on real-world streets. The visualization excludes traffic laws to focus purely on algorithm performance.
Customers
Developers, researchers, and educators interested in algorithmic efficiency, as well as enthusiasts in mapping technology and computational geography.
Unique Features
The ability to visualize pathfinding algorithms on real-world maps, offering insights into algorithm efficiency without the interference of traffic laws.
User Comments
Easy to understand algorithm behavior on actual maps.
Great tool for educational purposes in computer science.
Missing traffic law consideration can be a downside.
Intriguing for mapping technology enthusiasts.
Useful for preliminary research in computational geography.
Market Size
The global Geographic Information System (GIS) market was valued at $8.1 billion in 2020 and is expected to grow at a CAGR of 12.6% from 2021 to 2027.

Code Visualization Platform
Algorithm visualization platform
3
Problem
The current situation for users involves visualizing algorithms, data structures, and code execution primarily through static or non-interactive tools.
The drawbacks include a lack of real-time interactivity and limited support for Python and JavaScript, which can hinder effective learning and debugging of DSA concepts.
Solution
An algorithm visualization platform that allows users to experience real-time visualization of algorithms, data structures, and code execution in Python & JavaScript.
Users can effectively learn DSA, teach computer science, and debug code through this dynamic interactive platform.
Customers
Computer science students, educators, and software developers looking to enhance their understanding of algorithms and data structures.
Unique Features
The product offers real-time visualization specifically focused on Python and JavaScript, which aids interactive learning and debugging.
Market Size
The global EdTech and smart classroom market was valued at approximately $88.82 billion in 2021 and is expected to grow, driven by increasing digitization in education.

Problem
Users struggle to learn data structures and algorithms through static or non-visual methods like textbooks or raw code examples, leading to difficulty grasping abstract concepts and inefficient learning processes.
Solution
A web-based interactive algorithm visualizer tool that lets users visualize algorithms via highlighted code snippets and step-by-step execution history, enabling real-time exploration of how algorithms work.
Customers
Computer science students and educators seeking interactive resources to supplement traditional learning/teaching methods.
Alternatives
View all Visco alternatives →
Unique Features
Combines code highlighting with dynamic step history visualization, allowing users to trace algorithmic logic visually while correlating it directly with code execution.
User Comments
Simplifies complex algorithm concepts
Helps debug code by visualizing steps
Enhances coding interview preparation
Useful for classroom demonstrations
Intuitive interface for beginners
Traction
Launched in 2023, featured on Product Hunt with 500+ upvotes (exact user/revenue data not publicly disclosed).
Market Size
The global e-learning market, which includes algorithm education tools, was valued at $400 billion in 2022 (Statista).

Spectrum Music Visualizer Video Clips
An interactive music visualizer with many customizations
9
Problem
Users who want to create engaging music visualizations currently rely on generic visualizer tools. The drawbacks of the old situation include limited customization options and static designs that do not cater to personal creative needs.
Solution
A music visualizer and video clip maker tool that allows users to load their images and a song, configure the visualization, add text, and record the result as a video, saving it directly to the image gallery. Users can create personalized, dynamic visualizations with various customizations.
Customers
Music producers, video creators, digital artists, and social media content creators looking to enhance their audio-visual content.
Unique Features
The ability to load personal images and songs, configure visualizations, and save customized video outputs directly to the gallery, offering extensive personalization.
User Comments
Users appreciate the level of customization the tool offers.
It is noted as being user-friendly and intuitive.
Some users wish for more built-in templates.
A few users report bugs in the early version.
Overall, feedback indicates potential with room for growth.
Traction
The product is in the early stage with initial traction gathered from Product Hunt. Specific user numbers and revenue are not disclosed.
Market Size
The global music visualizer market is growing with the digital content creation industry and is expected to reach approximately $47.7 billion by 2025.
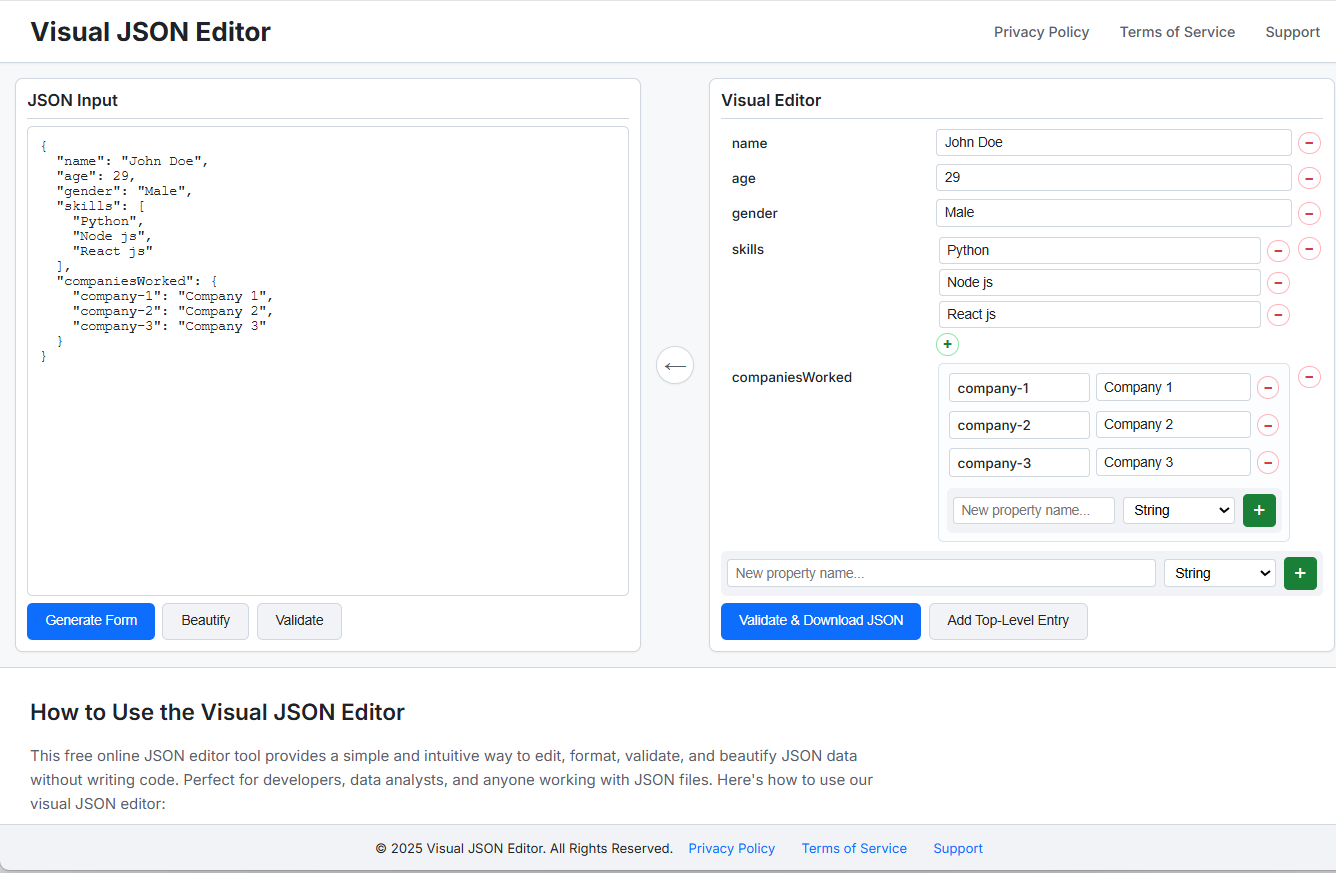
Visual JSON Editor
Free, visual JSON editor - Validation, Type Support etc
7
Problem
Users currently manually edit JSON code, which is error-prone, time-consuming, and difficult to visualize hierarchical structures.
Solution
A web-based JSON editor that converts JSON into interactive form fields for no-code editing, featuring real-time two-way synchronization between visual and raw JSON, validation, auto-formatting, and client-side data processing.
Customers
Developers, data analysts, and software engineers who need to edit JSON files but prefer visual interfaces over raw code manipulation.
Alternatives
View all Visual JSON Editor alternatives →
Unique Features
Two-way editing synchronization (visual ↔ code), 100% client-side operation (no data leaves the browser), dynamic object/array management with drag-and-drop, and instant validation/auto-formatting.
User Comments
Simplifies JSON editing for non-experts
Saves debugging time through instant validation
Eliminates manual code formatting
Seamless switching between visual and code modes
Privacy-focused due to local browser processing
Traction
Free tool with 2.3k+ upvotes on ProductHunt, featured in developer communities like DEV.to and GitHub (200+ stars). No disclosed revenue model; monetization likely via future premium features.
Market Size
The global data integration tools market, which includes JSON/data editors, was valued at $12.2 billion in 2023 (Statista). JSON remains a top-3 data format with 70%+ developer adoption (Stack Overflow Survey 2023).

Code Visualizer 3D
Built for Students, No Signups. No Paywalls. Just Learning.
7
Problem
Students and coders learning recursion rely on textbooks or online tutorials, which lack interactive 3D visualization, making it difficult to grasp complex recursive algorithms and their execution flow.
Solution
A web-based interactive 3D visualization tool that enables users to visualize and debug recursive algorithms step-by-step, enhancing understanding of data structures and algorithms (DSA) for coding interviews.
Customers
Computer science students, FAANG interviewees, and competitive programmers seeking to master recursion and algorithms through hands-on, visual learning.
Alternatives
View all Code Visualizer 3D alternatives →
Unique Features
Step-by-step 3D visualization of recursive algorithms, zero barriers to access (no signups/paywalls), and a focus on interview prep for DSA topics like tree traversals and dynamic programming.
User Comments
Helps demystify recursion for coding interviews.
Free access with no paywalls is a major plus.
Interactive 3D visuals beat static textbook diagrams.
Practical for DSA and competitive programming.
Recommended by computer science students.
Traction
Launched on ProductHunt with limited quantitative traction data available. Prioritizes accessibility (no paywalls/signups) and educational focus over monetization.
Market Size
The global $1.2 billion DSA and coding interview prep market (2023) fuels demand for visual learning tools like this.

The Algorithm
Source code for Twitter's recommendation algorithm
287
Problem
Users often find themselves inundated with irrelevant or less engaging content on their Home Timeline, leading to a decreased interest and engagement with the platform. The irrelevant or less engaging content on users' timelines is a significant drawback.
Solution
The Twitter Recommendation Algorithm is a framework consisting of a set of services and jobs aimed at optimizing content delivery on users' Home Timelines. By applying this algorithm, users receive more relevant and engaging content, tailored to their interests and interactions on the platform.
Customers
The primary users of the Twitter Recommendation Algorithm are social media managers, content creators, advertisers, and regular users looking to enhance their engagement and content relevancy on the platform.
Unique Features
The unique aspect of this solution is its ability to dynamically adjust and present content based on individual user behavior and preferences, ensuring a highly personalized and engaging experience.
User Comments
Currently, there are no direct user comments available for analysis.
Traction
Specific traction details such as number of users influenced, improvements in engagement rates, or revenue impacts are not provided.
Market Size
The global social media management market size was valued at $14.3 billion in 2021 and is expected to grow significantly, indicating a substantial market for products enhancing user engagement and content relevance.

DSA Visualizer
Visualize & learn dsa the smart way
4
Problem
Users traditionally learn Data Structures and Algorithms (DSA) through textbooks or static online resources, struggling to visualize complex structures and dynamic algorithm processes, leading to ineffective learning and interview preparation.
Solution
A web-based interactive visualization tool that enables users to explore DSA concepts like stacks, queues, and sorting algorithms through real-time animations. Example: users can simulate a stack’s push/pop operations or observe sorting algorithms step-by-step.
Customers
Computer science students, self-taught developers preparing for technical interviews, and educators seeking interactive teaching aids.
Alternatives
View all DSA Visualizer alternatives →
Unique Features
Free, open-source, and focuses on real-time interaction with visualizations (trees and graphs in development). Combines theory with hands-on exploration, unlike static tutorials.
User Comments
Simplifies abstract DSA concepts
Enhances interview prep efficiency
Engaging for visual learners
Free access removes cost barriers
Open-source encourages community contributions
Traction
1.5K+ upvotes on ProductHunt, listed as #1 Product of the Day. Open-source with GitHub contributions, but no disclosed revenue data (free product).
Market Size
The global coding bootcamp market, a key indicator for DSA learning tools, is projected to reach $13.4 billion by 2027 (Holoniq, 2023).