What is CalcGen AI?
Data Viz has never been this much fun! Beautiful, interactive, customizable charts and graphing calculators in moments- Use your data, or let our agent research it for you. Simply describe what you want plotted, and what you want to control. Happy Charting!
Problem
Users struggle to create beautiful, interactive, and customizable data visualizations quickly
Users have difficulty generating charts and graphing calculators in a fast and efficient manner, leading to time-consuming processes and limited visualization options.
Solution
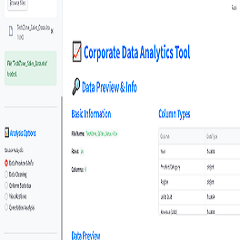
Browser-based tool for generating customizable charts and graphing calculators
Users can create beautiful, interactive data visualizations by simply describing what they want plotted and controlled, saving time and allowing for personalized outputs.
Customers
Data analysts, researchers, educators, business professionals
Data analysts, researchers, educators and business professionals looking to create engaging and customizable data visualizations.
Unique Features
Agent research option to assist users in visualizing data
Interactive and customizable charts and graphing calculators
User Comments
Easy to use even for beginners
Impressive graphics and customization options
Saves time and effort in creating data visualizations
Great tool for presenting information in a visually appealing way
Offers diverse chart types and styling options
Traction
350+ upvotes on ProductHunt
Positive user feedback on ease of use and visual appeal
Market Size
The global data visualization market size was valued at $5.9 billion in 2020 and is projected to reach $10.2 billion by 2027.