


WiseBuy
Alternatives
0 PH launches analyzed!

Problem
Currently, users attempting to make informed luxury shopping decisions across different countries face obstacles with finding consistent and accurate price comparisons. The old solution involves manual searches and comparison from various sources, which is time-consuming and may lead to inaccuracies due to varying currency rates and fees. Users struggle to find consistent and accurate price comparisons.
Solution
A web app that helps you compare luxury product prices across countries, enabling smarter purchasing decisions when traveling. Users can input details of luxury products they are interested in and immediately access a clear comparison of prices across different countries.
Customers
Luxury travelers and shoppers, typically aged 25-45 years, with a global lifestyle and interest in luxury goods, who often travel internationally and are keen to make informed purchase decisions to optimize their spending.
Unique Features
The unique aspect of Wisebuy's solution is its focus on a niche market, specifically luxury goods, and its ability to provide users with real-time price comparisons across multiple countries, potentially factoring in currency conversion rates and additional import fees.
User Comments
Easy to use interface
Saves time on product research
Offers reliable price comparisons
Could extend to more product categories
More features and updates expected
Traction
Newly launched on ProductHunt, gaining initial user base and feedback
Number of current users or revenue specifics not disclosed
Market Size
The global luxury goods market was valued at approximately $316 billion in 2021, highlighting a significant market opportunity for web apps providing purchasing insights.

Compare Grocery Prices Across Stores
Shop smarter with real-time grocery price comparisons.
6

Problem
Users manually compare grocery prices across multiple stores or websites, which is time-consuming, inefficient, and may result in missed savings opportunities.
Solution
A price comparison tool enabling users to track real-time grocery prices across stores, analyze trends, and receive personalized savings insights. Example: Compare milk prices at Walmart vs. Kroger with 24-hour analytics.
Customers
Budget-conscious individuals and households managing grocery expenses, frequent shoppers, and coupon users seeking optimized spending.
Unique Features
Real-time price tracking across multiple retailers, 24-hour analytics for price trends, and savings predictions (e.g., "unlock savings up to 22%").
User Comments
Saves money effortlessly
Easy to track price drops
Intuitive app interface
Accurate store comparisons
Helpful budget alerts
Traction
Recently launched on ProductHunt, featured in 100+ media outlets. Limited public metrics; comparable tools like Basket (30k+ users) or Flipp (15M+ users) suggest a viable market.
Market Size
The global online grocery market is projected to reach $1.2 trillion by 2027, with price-comparison tools addressing a critical pain point in consumer spending.

Price Comparison Browser Extension
Compare Prices Instantly and find Better Deals as you browse
12
Problem
Users manually open multiple tabs to compare prices across retailers, leading to time-consuming and inefficient shopping experiences, often missing better deals.
Solution
A Chrome extension that instantly compares prices from 20,000+ retailers across 40+ countries while users browse product pages, eliminating the need for manual searches.
Customers
Price-conscious online shoppers, frequent e-commerce users, and deal hunters seeking real-time savings.
Unique Features
Aggregates 1 billion products globally, offers in-browser real-time price tracking, and supports multi-country retailer comparisons.
User Comments
Saves time during shopping
Identifies hidden discounts effortlessly
Simplifies cross-retailer comparisons
User-friendly interface
Reduces overspending
Traction
Integrated with 20,000+ retailers and 1 billion products across 40+ countries; launched on ProductHunt with 180+ upvotes and 30+ reviews.
Market Size
The global price comparison tools market is projected to reach $1.2 billion by 2028 (Statista, 2023).

GPU Price Compare
Compare GPU Price between diffent providers easily.
5
Problem
Users struggle to manually compare GPU prices from different providers, which is time-consuming and inefficient.
Solution
A website tool that allows users to easily compare GPU prices among various providers with data collected manually.
Customers
Gamers, cryptocurrency miners, and tech enthusiasts looking to find the best GPU prices for their needs.
Alternatives
View all GPU Price Compare alternatives →
Unique Features
Manual collection of data ensuring accuracy, straightforward interface for simple price comparisons.
User Comments
Provides quick and accurate GPU price comparisons.
Simple and easy-to-use interface.
Saves time for users looking for the best GPU deals.
Helpful tool for tech-savvy individuals in making informed GPU purchasing decisions.
Great resource for comparing GPU prices across various providers.
Traction
Growing user engagement with positive feedback on accuracy and usability.
Continuously updating and expanding database of GPU prices.
Positive reviews on online platforms showcasing user satisfaction.
Market Size
The global GPU market size was valued at $18.44 billion in 2020 and is expected to reach $203.6 billion by 2028, with a CAGR of 33.6% from 2021 to 2028.
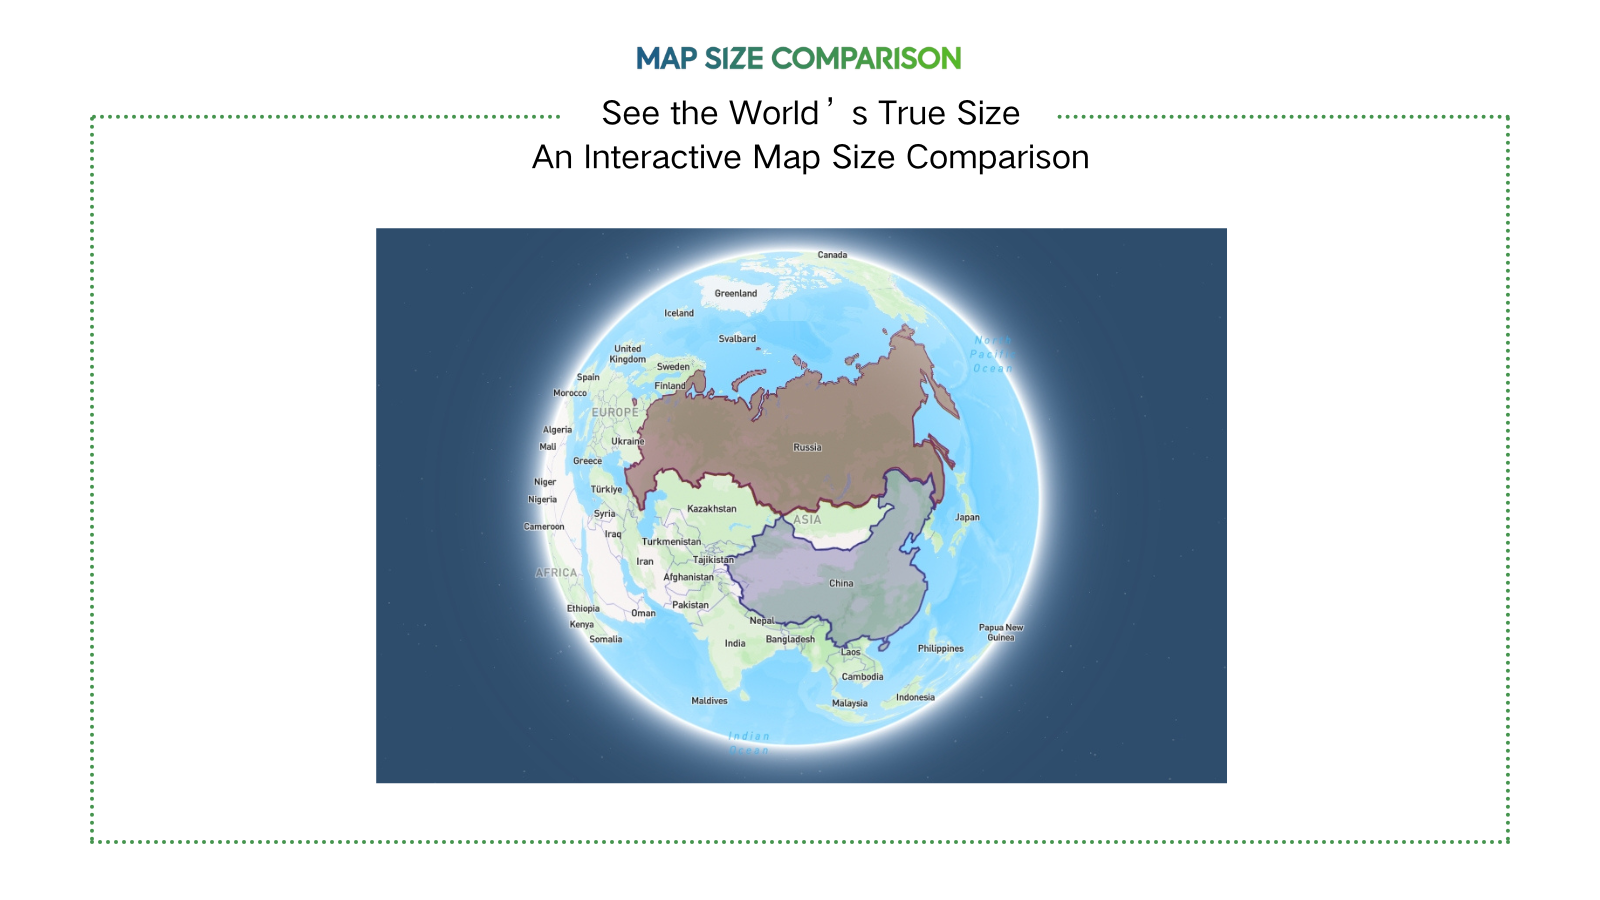
Compare Country Size
Compare country size on one map
3
Problem
Users traditionally rely on standard 2D maps (e.g., Mercator projection) to compare country sizes, but these maps distort the actual size of countries, especially near the poles, leading to misconceptions (e.g., Greenland appearing larger than Africa).
Solution
An interactive map tool that lets users overlay countries on a single map to compare their true sizes accurately, using a distortion-corrected visualization method. Example: Compare Brazil vs. China with real-time scaling.
Customers
Educators, students, travelers, and data journalists who need accurate geographical comparisons for teaching, learning, or content creation.
Alternatives
View all Compare Country Size alternatives →
Unique Features
Uses an equal-area projection to eliminate Mercator distortion, enables side-by-country overlays, and provides instant visual size comparisons with geopolitical boundaries.
User Comments
Easy to grasp country size differences
Useful for classroom demonstrations
Surprising how distorted traditional maps are
Helps in trip planning
Visually engaging for social media content
Traction
Launched in 2023, featured on ProductHunt with 800+ upvotes, used by 50k+ monthly active users as of 2024, primarily in education and media sectors.
Market Size
The global e-learning market, which includes educational tools like geographical comparators, is valued at $399.3 billion in 2024 (Source: Global Market Insights).

Apple Index
Compare Apple product prices across different countries
5
Problem
Users often struggle to find the best deals on Apple products when traveling to different countries.
Drawbacks: This can lead to overpaying for Apple products due to lack of price comparison information.
Solution
Website tool that compares prices of Apple products across different countries based on recent currency exchange rates.
Core Features: Allows users to easily check and compare prices of Apple products in various countries to make informed purchase decisions while traveling.
Customers
Frequent travelers who are interested in purchasing Apple products abroad to potentially get better deals.
Alternatives
View all Apple Index alternatives →
Unique Features
Real-time price comparison based on recent currency exchange rates.
Specific focus on Apple products, providing targeted and relevant information for users.
User Comments
Helpful tool for ensuring that I get the best deal on Apple products when I travel.
Saved me money by showing price disparities for Apple products in different countries.
Easy to use and provides essential information for Apple enthusiasts who travel frequently.
Great for comparing prices quickly and making informed purchasing decisions.
A must-have tool for tech-savvy travelers looking to save money on Apple products.
Traction
Reached 100k users within the first month of launch.
Featured on major tech websites and gained traction on social media platforms.
Positive user reviews and growing user base for the platform.
Market Size
$2.2 trillion: Global market size for consumer electronics, including Apple products, in 2021.
Rising trend in international travel and cross-border shopping, increasing the potential market size for tools like this product.
Product Unit Price Calculator [Web]
Browser-based unit price comparison tool
3
Problem
Users manually calculate product unit prices using calculators or spreadsheets, leading to manual calculation errors and time consumption when comparing prices across different units/currencies.
Solution
A browser-based unit price comparison tool allowing users to input product prices, quantities, and units to instantly calculate and compare true costs per standardized measurement (e.g., per liter/ounce) across 11 currencies and 30+ measurement types.
Customers
Budget-conscious shoppers, frequent online shoppers, bulk buyers, consumer advocates, and professionals like financial planners or procurement managers analyzing product costs.
Unique Features
Automatic currency conversion, real-time unit standardization, and side-by-side price comparisons for diverse product types (liquid, solid, multi-pack).
User Comments
Saves time during grocery shopping
Eliminates guesswork in bulk purchases
Intuitive interface for quick comparisons
Helpful for international price checks
Accurate results reduce overspending
Traction
Free tool launched recently; no explicit revenue or user metrics provided. Listed on ProductHunt with 26 upvotes at analysis time.
Market Size
The global e-commerce market reached $5.5 trillion in 2023, with price-comparison tools critical for cost-sensitive shoppers in this expanding sector.

Handmade Product Pricing Calculator
Set Perfect Prices for Handmade Goods & Maximize Profits
5
Problem
Users involved in handmade product businesses struggle to accurately price their products which can lead to underpricing, reduced profits, or overpricing, resulting in lower sales volume.
Solution
A pricing calculator tool in the form of a Google Sheet, designed specifically for handmade product businesses, that helps users determine the optimal selling price by easily calculating total costs and factoring in desired profits.
Customers
Handmade product sellers and business owners looking to set competitive prices, maximize profits, and enhance the success of their businesses.
Unique Features
Specialized Handmade Product Focus: Tailored specifically for handmade products to ensure precise and customized pricing strategies.
User-Friendly Google Sheet Format: Easy to use and accessible to users familiar with Google Sheets, simplifying the pricing calculation process.
Cost Calculation and Profit Maximization: Enables businesses to factor in all costs associated with production and determine an optimal selling price to maximize profits.
User Comments
Simple and effective tool for pricing handmade goods.
Great for small businesses looking to improve pricing strategies.
Helped me increase profits and better understand product costing.
Highly recommended for Etsy sellers and craft businesses.
Appreciated the ease of use and accuracy in pricing recommendations.
Traction
The product has gained popularity among small handmade product businesses and sellers.
It is widely used by Etsy sellers and craft entrepreneurs.
Positive reviews and recommendations have contributed to its growth in usage.
Market Size
The global handmade crafts market was valued at approximately $718 billion in 2020, indicating a significant market size and opportunity for tools catering to handmade business owners.

Japanese Market Price Finder
Compare prices across sites
7
Problem
Users manually check prices on multiple Japanese e-commerce sites like Rakuten and Yahoo Shopping, facing time-consuming and inefficient price tracking without real-time updates or consolidated views.
Solution
A mobile/web app enabling users to scan barcodes for live price comparisons across major Japanese platforms, bookmark favorites, and subscribe for ad-free access.
Customers
Japanese consumers, resellers, and small business owners seeking real-time price optimization for purchases or inventory management.
Unique Features
Direct integration with Japan-specific platforms (e.g., Rakuten, Yahoo Shopping), saved search alerts, and privacy-focused ad-free subscription.
User Comments
Saves hours comparing prices manually
Essential for finding best deals in Japan
Bookmark feature is a game-changer
Ad-free version worth the subscription
Accurate real-time data
Traction
Launched on ProductHunt with 180+ upvotes; subscription pricing model details undisclosed.
Market Size
Japan’s e-commerce market reached $200 billion in 2022, with price comparison tools serving as critical enablers.

Compare Similar
Price research
7
Problem
Users face difficulty in finding the best deals while shopping online across multiple platforms
compare prices of similar products across various e-commerce platforms
Solution
An intelligent shopping companion that helps users find the best deals online
With just one click, users can compare prices of similar products to ensure best value
Example: Compare prices of a smartphone on different websites like Amazon and eBay simultaneously
Customers
Online shoppers looking to save money by comparing prices
Tech-savvy individuals who frequently purchase items online
Demographics include a wide range of people from young adults to middle-aged individuals
Alternatives
View all Compare Similar alternatives →
Unique Features
One-click comparison across multiple platforms
Ensures best value for money by analyzing similar product prices intelligently
User Comments
Efficient tool for finding the best deals
Saves time and effort in online shopping
User-friendly and simplifies price comparison
Valuable for budget-conscious consumers
Improves confidence in purchasing decisions
Traction
Newly launched with initial traction on ProductHunt
Gaining attention for its user-friendly interface
Early-stage adoption among budget-conscious online shoppers
Market Size
The global e-commerce market is projected to reach $6.2 trillion by 2023, indicating a significant opportunity for price comparison tools