


StopIt
Alternatives
0 PH launches analyzed!

Problem
Users struggle with managing cravings for smoking, vaping, stress eating, and anxiety using traditional methods like willpower or generic apps. Traditional methods lack speed, research-backed efficacy, and immediate visual engagement.
Solution
A digital tool (likely a mobile/web app) offering EMDR-inspired visual therapy patterns to disrupt cravings instantly. Users interact with dynamic visuals for 30 seconds to reduce urges, backed by neuroscience principles.
Customers
Adults aged 18-45 seeking to quit smoking/vaping, control emotional eating, or manage anxiety. Includes professionals, students, and health-conscious individuals prioritizing habit-breaking solutions.
Unique Features
Combines EMDR therapy (eye movement desensitization) with craving management, 30-second sessions for immediate relief, and clinical research validation.
User Comments
Quickly reduces cravings
Easy to use during urges
Feels scientifically credible
Helps with stress-related habits
More engaging than meditation apps
Traction
Launched on Product Hunt (2024) with 500+ upvotes. No public MRR/user data; founder has 1.2K followers on LinkedIn.
Market Size
Global smoking cessation market size was $7.7 billion in 2024 (Grand View Research), with anxiety/stress management apps valued at $4.6 billion (Allied Market Research).

30 Second Dance Party - Volume II
The greatest dance party button ever just got more greater
114

Problem
Traditional methods for initiating impromptu dance parties can be lackluster, lacking the spontaneity and excitement needed to truly energize a gathering. The old methods fail to instantly elevate the mood or create an engaging, memorable experience.
Solution
A unique button that, when pressed, triggers a 30-second burst of one of five new party-starting beats, paired with visually striking colors previously thought impossible on the known visual spectrum, ensuring an instant elevation in mood and atmosphere.
Customers
Event organizers, party hosts, and individuals looking to add an element of spontaneity and fun to their gatherings.
Unique Features
Features 5 new party-starting beats and utilizes colors on the visual spectrum previously thought unimaginable, creating a unique, sensory stimulating experience.
User Comments
Innovative approach to party starting
Unique colorway enhances the experience
Easy to use
Instant mood lifter
Adds memorable touch to parties
Traction
The specific traction data for 30 Second Dance Party Volume II could not be found as of the knowledge cutoff in April 2023. Therefore, traction details such as version updates, user numbers, or financials are not available.
Market Size
The global party supplies market, inclusive of party enhancing products like 30 Second Dance Party Volume II, was valued at $12 billion in 2021, with expectations of significant growth.

Visual CSS
Visual CSS Collaborate with Intelligence. No coding Required
3
Problem
Users manually edit CSS code with technical expertise to modify website designs, leading to time-consuming processes and limited design experimentation. manually editing CSS code with technical expertise
Solution
A no-code visual editor tool enabling users to style websites via AI-generated CSS. visually edit website styles in real-time without coding, generating clean CSS code via AI
Customers
Web designers, front-end developers, and digital marketers seeking rapid prototyping or design iteration without deep coding knowledge.
Unique Features
AI generates clean, maintainable CSS code; real-time collaboration; visual editing directly on live websites.
User Comments
Saves hours of manual coding
Intuitive for non-developers
Collaboration features streamline feedback
AI outputs production-ready code
Real-time editing speeds up iterations
Traction
Launched on ProductHunt in 2023; specific metrics (MRR, users) not publicly disclosed.
Market Size
The global web design market, driven by no-code tools, was valued at $40 billion in 2022 (Statista, 2023).

CSV Data Visualizer
CSV Visualizer: Turn raw data into stunning visuals fast! 📊
5
Problem
Users often struggle to visualize CSV data and create compelling visuals quickly.
Existing solutions for data visualization may be complex, time-consuming, and require a steep learning curve.
Solution
Web-based CSV Data Visualizer tool
Users can quickly turn raw data into stunning visuals in seconds without the need for subscriptions or hidden fees.
Core features include: fast data visualization, user-friendly interface, no subscriptions or fees.
Customers
Students, analysts, and data geeks who need to visualize CSV data quickly and effectively.
Alternatives
View all CSV Data Visualizer alternatives →
Unique Features
Fast data visualization in seconds
No subscriptions or hidden fees, 100% free online tool.
User Comments
Intuitive tool for quick data visualization.
Great for students and data analysts.
The free offering is a significant advantage.
Simple and effective solution for visualizing CSV data.
User-friendly interface for creating stunning visuals.
Traction
Over 5,000 users registered within the first week of launch.
Continuously improving features based on user feedback.
No specific revenue data provided.
Market Size
Global data visualization market size was estimated at $5.9 billion in 2020, and it is projected to reach $10.2 billion by 2025 with a CAGR of 11.6%.

AI Website in 30 seconds
Build & host a website faster than you make coffee
103
Problem
Creating a website requires technical knowledge, time, and resources, often making it difficult for individuals or small businesses to have an online presence. Technical knowledge, time, and resource constraints are the main drawbacks.
Solution
The product is an AI-driven platform that offers a way to build and host websites and landing pages within 30 seconds without requiring drag-and-drop. Users can shuffle through high-converting layouts, access free hosting, SEO, unlimited stock photos and videos, set up an email collection form, utilize A/B testing, and view simple analytics, all supporting multilingual pages. Build and host AI-generated websites quickly with no need for technical expertise.
Customers
The primary users of this product are small business owners, freelancers, marketers, and individuals who seek an easy, quick way to establish an online presence without dealing with the complex technical aspects of website development. Small business owners, freelancers, marketers.


Unique Features
The product's unique selling points include its AI-driven quick generation of websites and landing pages in less than 30 seconds, the offer of free hosting for 100 years, and the shuffling through high-converting layouts without the need for drag-and-drop functionality.
User Comments
Due to the constraints, user comments cannot be provided.
Traction
Due to the constraints, specific traction details cannot be provided.
Market Size
The global website builder platform market was valued at $2.4 billion in 2020 and is expected to grow to $13.6 billion by 2027.

Budget Visual
Free App to Help You Visualize Your Finances
6
Problem
Users face challenges in understanding and managing their finances using traditional methods.
The current situation involves manually checking credit card or bank statements.
Analyzing financial transactions without a proper tool can lead to confusion and inaccuracies.
Solution
A free app for visualizing finances.
Users can upload their credit card or bank statements to get a breakdown with visuals.
Quickly analyze transactions by time frames and categories, simplifying financial management.
Customers
Individuals of all ages looking to understand and manage their finances better.
Financially conscious users who regularly monitor their expenses.
Budgeting enthusiasts and people aiming to improve financial health.
Alternatives
View all Budget Visual alternatives →
Unique Features
It offers a free service for comprehensive visual breakdowns.
User-friendly interface that effectively organizes and categorizes expenses.
User Comments
The app is user-friendly and extremely helpful.
People appreciate the visual breakdown feature.
Some users mentioned the app's capability to simplify complex financial data.
The categorization feature is particularly popular.
Users feel it enhances their understanding of personal finances.
Traction
Launched with innovative features to visualize personal financial data.
Positioned as a free tool, it aims to attract a broad user base.
Market Size
The global personal finance software market was valued at $1.05 billion in 2019 and is projected to reach $1.57 billion by 2027 with a CAGR of 5.7%.
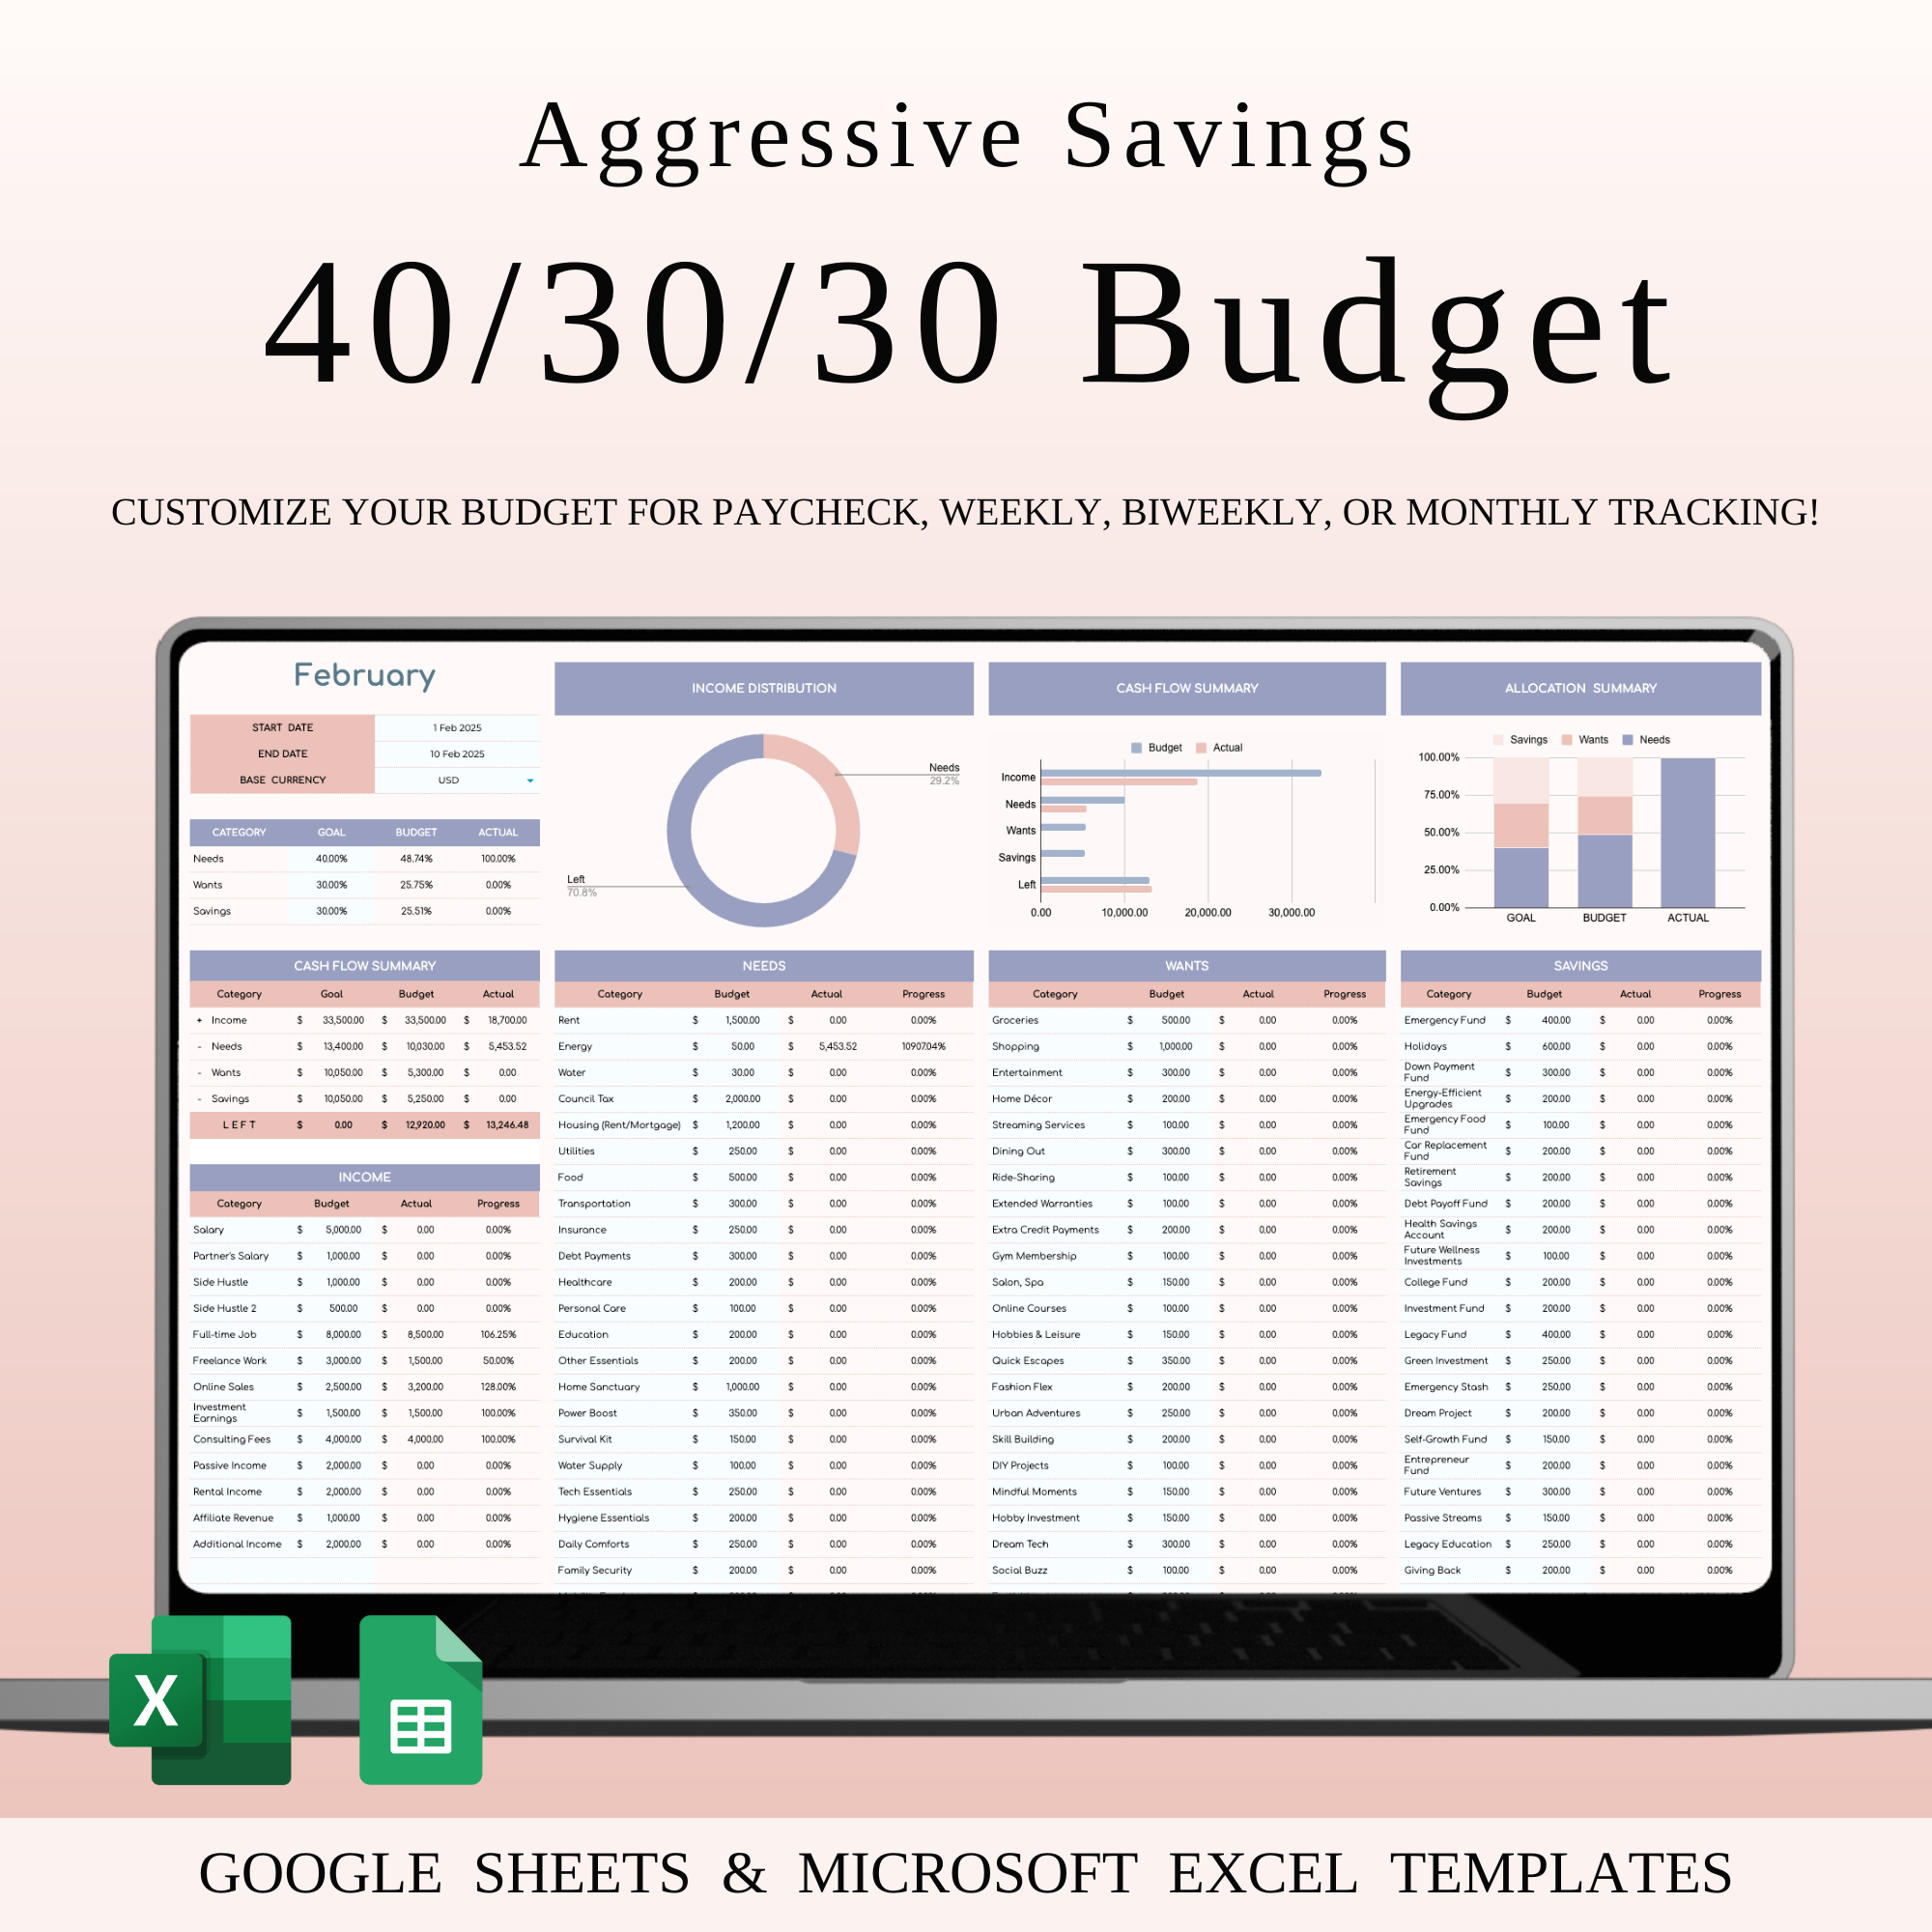
40/30/30 Budget Spreadsheet Template
Excel & Google Sheets
4
Problem
People struggle with effective budget management using traditional spreadsheets.
Lack of a structured budgeting approach often makes personal finance management challenging.
Solution
A budget spreadsheet template
Users can master their finances by allocating specific percentages of their income to essentials, savings, and personal goals.
Allocate 40% for essentials, 30% for savings, and 30% for personal goals
Customers
Individuals and families
People looking to improve their personal finance management. Users who prefer digital tools like Excel & Google Sheets for budgeting.
Unique Features
Focuses on a specific budgeting strategy: 40/30/30
Compatible with both Excel and Google Sheets
Encourages balanced financial planning
User Comments
Easy to use and implement in daily budgeting
Great tool for financial discipline
Helpful in achieving savings goals
Highly customizable for different financial situations
Versatile with both Excel and Google Sheets compatibility
Market Size
The global personal finance software market was valued at $1.1 billion in 2019 and is expected to grow significantly through 2027.

Body Visualizer
Body Visualizer
5
Problem
Users struggle to achieve their fitness goals and track their progress precisely. Lack of visual tools can lead to less motivation and inaccurate self-assessment.
Solution
Body Visualizer is an AI-powered 3D visualization tool that helps users set fitness goals, track progress, and achieve their ideal body shape with scientific precision. Users can visualize their transformation and track specific body metrics.
Customers
Fitness enthusiasts, personal trainers, health coaches, and individuals focused on body transformation and fitness progress tracking.
Unique Features
AI-powered 3D visualization
Scientific precision in progress tracking
Customizability of fitness goals and metrics
User Comments
Visually appealing and motivating
Tracks progress accurately
User-friendly interface
Helpful for personal trainers
Improves fitness accountability
Traction
Recently launched
Featured on ProductHunt
Market Size
The global fitness app market was valued at $4.4 billion in 2020 and is expected to grow significantly in the coming years.

Visual ChatGPT
Talking, drawing and editing with visual foundation models
88
Problem
Users find it challenging to interact with AI solely through text when their queries involve visual contexts, leading to limited understanding and responses from the AI. Interacting with AI using both text and images.
Solution
Visual ChatGPT is an advanced interaction platform that combines talking, drawing, and editing with visual foundation models. It enables users to communicate with ChatGPT using both words and images, effectively addressing complex visual questions and multi-step instructions. The integration of various visual models with ChatGPT enhances the AI's learning with the aid of pictures. Communicate with ChatGPT using both words and images.
Customers
Researchers in AI and computer vision, educators looking to integrate AI into visual learning, and developers creating applications that require understanding of visual context.
Alternatives
View all Visual ChatGPT alternatives →
User Comments
Impressed by the innovative combination of text and visual inputs.
Enhances the usability of ChatGPT for visual tasks.
Great tool for educational purposes.
A significant step forward in AI interaction.
Useful for developers integrating AI into visually driven apps.
Traction
As the product is relatively new and specifics about user metrics or financials are not publicly disclosed, concrete numbers regarding traction are unavailable.
Market Size
The AI in computer vision market is expected to grow from $6.6 billion in 2021 to $144.46 billion by 2028.

Second Brain
AI Visual Board and Knowledge Base
310
Problem
Users manage knowledge and content across fragmented platforms, leading to inefficient AI interaction and disconnected information.
Solution
A AI-powered visual board and knowledge base where users aggregate content, create interconnected nodes, and interact with all content through AI chats (e.g., querying documents, brainstorming ideas).
Customers
Researchers, product managers, and content creators needing centralized, AI-enhanced knowledge synthesis and ideation.
Unique Features
Interconnected chat nodes allow AI interactions with any content (documents, images, notes) on a visual canvas, accumulating context over time.
User Comments
Streamlines idea organization
Game-changer for research workflows
Seamless AI integration
Visual context boosts creativity
Saves hours weekly
Traction
Launched 4 days ago, 300+ upvotes on ProductHunt
Founder has 1.2K followers on X
Market Size
Global knowledge management market projected to reach $36 billion by 2028 (Grand View Research, 2023).