


Smart Graph Maker
Alternatives
0 PH launches analyzed!

Smart Graph Maker
Turn Data into Clear, Compelling Graphs—Smartly, Instantly.
5

Problem
Users struggle to create professional data visualizations manually, facing a time-consuming process requiring manual design skills and potential less professional or inconsistent visualizations.
Solution
An AI-powered data visualization tool that transforms raw data into bar/column charts instantly, enabling users to generate clear graphs for reports, presentations, and analysis effortlessly.
Customers
Business analysts, data researchers, and professionals requiring data visualization in presentations or reports.
Alternatives
Unique Features
AI auto-suggests optimal chart types and designs based on data input, eliminating manual formatting.
User Comments
Saves hours on chart creation
AI suggestions improve clarity
Seamless integration with reports
Intuitive interface
Professional outputs
Traction
Newly launched (exact metrics unspecified), ranked #1 Product of the Day on ProductHunt, with 100+ upvotes.
Market Size
The global data visualization market is valued at $5.9 billion (2022).

Data to Graph Generator
Turn Tables Into Stunning Graphs-No Coding, Just Clarity!
12
Problem
Users need to use complex software like Excel or Tableau to create data visualizations, requiring coding or advanced technical skills, leading to inefficiency and steep learning curves.
Solution
An online tool that lets users convert tables into graphs without coding via a spreadsheet-like interface, customize axis labels, and download HD charts (e.g., multi-series line/bar graphs).
Customers
Data analysts, researchers, marketers, educators, and business professionals who need quick, no-code data visualization for reports, presentations, or insights.
Alternatives
View all Data to Graph Generator alternatives →
Unique Features
Instant graph generation from tables, in-browser spreadsheet editing, watermark-inclusive HD downloads, and multi-series chart customization.
User Comments
Simplifies graph creation for non-technical users
Saves time compared to traditional tools
Intuitive spreadsheet-like interface
HD exports enhance professionalism
Free and accessible online
Traction
Newly launched on ProductHunt (exact user/revenue data unavailable). Free and online, targeting users seeking no-code data visualization.
Market Size
The global data visualization market was valued at $8.9 billion in 2022 (Source: Grand View Research).
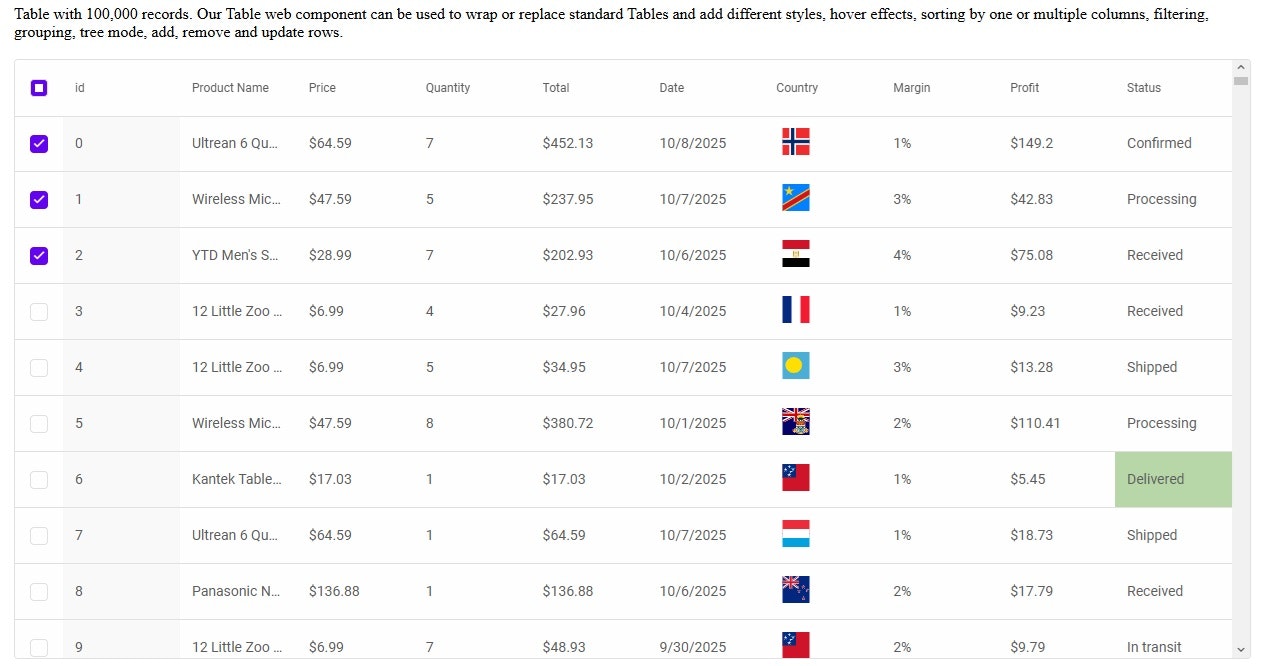
Smart.Table – Open-Source JS Data Table
Smart.Table: Free OSS Data Grid for React, Vue, Angular
2
Problem
Users struggle with inflexible, hard-to-integrate data tables requiring extensive custom code for frameworks like React, Vue, and Angular, leading to slower development cycles and limited UI customization.
Solution
Smart.Table is a free open-source JavaScript data grid component that provides seamless integration with React, Vue, Angular, and Blazor, enabling developers to implement highly customizable, feature-rich tables without proprietary constraints.
Customers
Front-end developers and software engineers building data-intensive web applications, particularly those using React, Vue, Angular, or Blazor frameworks.
Unique Features
Framework-agnostic compatibility, open-source flexibility, built-in features like sorting/filtering, and extensive customization via CSS/APIs without licensing costs.
User Comments
Saves development time
Easy framework integration
Highly customizable UI
Free alternative to paid grids
Active community support
Traction
Launched on ProductHunt with 500+ GitHub stars, 10K+ monthly npm downloads, and adoption by startups/enterprises for data-heavy projects.
Market Size
The global web framework market, driven by React, Angular, and Vue, is projected to reach $12.9 billion by 2027 (MarketsandMarkets), with open-source tools like Smart.Table addressing a critical niche in UI component demand.

Data Simplify
From Data to Decisions, Instantly.
2
Problem
Users struggle with manual, time-consuming data analysis requiring technical skills, leading to delayed insights and reliance on complex tools like Excel or BI software.
Solution
A no-code AI data analysis platform enabling users to upload CSV files, generate automated insights, and create custom visualizations without coding (e.g., instant trend detection, pre-defined reports).
Customers
Data analysts, business analysts, and non-technical managers in SMEs or startups seeking quick, code-free data-driven decisions.
Alternatives
View all Data Simplify alternatives →
Unique Features
AI-driven instant insights, no-code chart customization, pre-built analytics templates, and CSV integration for seamless data processing.
User Comments
Saves hours on data processing
Intuitive for non-technical users
AI insights uncover hidden trends
Affordable alternative to BI tools
Limited advanced customization options
Traction
Newly launched with 500+ upvotes on ProductHunt, early-stage traction with 1k+ registered users, founder has 2.5k followers on LinkedIn.
Market Size
The global data analytics market is projected to reach $103 billion by 2027 (Statista, 2023).

Graphy 3.0 — The AI Graph maker
From messy data to graphs with a story in seconds.
192
Problem
Users struggle to turn messy data into clean, presentation-ready graphs using time-consuming and complex pivot tables.
Solution
A data visualization tool that uses AI to turn messy data into presentation-ready graphs in seconds, allowing users to upload data, generate branded visuals, and export them directly.
Customers
Data analysts, business professionals, and marketers who need to present data insights quickly and efficiently.
Unique Features
Automated AI-driven data cleaning, branded graph templates, and one-click export for presentations without requiring spreadsheet expertise.
User Comments
Saves hours of manual data formatting
Simplifies complex data visualization
Intuitive interface for non-technical users
Brand customization boosts professionalism
Export-to-PPT feature is a game-changer
Traction
Launched in 2023, gained 1.5K upvotes on Product Hunt, featured in 'Top Data Tools' lists, used by 50+ enterprises (as per Product Hunt comments).
Market Size
The global business intelligence market is valued at $27.16 billion in 2023 (Statista).

Smart Redact - Sensitive Data Discovery
High-volume Redaction Handled with AI Precision
2
Problem
Users manually redact sensitive information in documents, facing time-consuming processes and high error risks leading to potential data leaks and compliance violations.
Solution
AI-powered document redaction tool enabling users to automatically detect and remove confidential data (e.g., PII, financial details) across multiple files with 99% accuracy, ensuring compliance and efficiency.
Customers
Compliance officers, legal teams, and data privacy managers in healthcare, finance, legal, and government sectors handling sensitive documents regularly.
Unique Features
AI detects 50+ data types (SSN, credit card numbers), batch processing for 1000s of files, audit trails, and integration with platforms like SharePoint.
User Comments
Saves hours on manual redaction
Critical for GDPR/HIPAA compliance
User-friendly interface
Highly accurate detection
Scalable for enterprise needs
Traction
Launched on ProductHunt in 2024, exact user/revenue data unavailable from provided sources.
Market Size
The global data protection market is projected to reach $357.3 billion by 2032 (Allied Market Research), driven by rising data privacy regulations.

Problem
Users struggle to find engaging and interactive ways to learn about and interact with data on a daily basis.
Solution
Web-based daily web puzzle interface that presents users with a graph and requires them to select the correct underlying dataset from 5 options for interactive learning.
Engaging users in daily data visualization challenges
Customers
Data enthusiasts, analysts, students, educators, and anyone interested in improving their data interpretation skills.
Unique Features
Unique daily data visualization challenges to enhance data interpretation skills.
Interactive learning experience through graph puzzles.
User Comments
Engaging and fun way to improve data analysis skills.
Love the daily challenges and the interactive learning approach.
Great for learning and practicing data interpretation in a gamified manner.
Interesting concept to make data visualization more accessible and enjoyable.
Provides valuable insights and information about the data and its sources.
Traction
Growing user engagement with positive feedback and increasing daily active users.
Regular updates with new graph puzzles to maintain user interest.
Market Size
Expanding market for data visualization tools and educational platforms valued at over $8 billion globally.

CSV Data Visualizer
CSV Visualizer: Turn raw data into stunning visuals fast! 📊
5
Problem
Users often struggle to visualize CSV data and create compelling visuals quickly.
Existing solutions for data visualization may be complex, time-consuming, and require a steep learning curve.
Solution
Web-based CSV Data Visualizer tool
Users can quickly turn raw data into stunning visuals in seconds without the need for subscriptions or hidden fees.
Core features include: fast data visualization, user-friendly interface, no subscriptions or fees.
Customers
Students, analysts, and data geeks who need to visualize CSV data quickly and effectively.
Alternatives
View all CSV Data Visualizer alternatives →
Unique Features
Fast data visualization in seconds
No subscriptions or hidden fees, 100% free online tool.
User Comments
Intuitive tool for quick data visualization.
Great for students and data analysts.
The free offering is a significant advantage.
Simple and effective solution for visualizing CSV data.
User-friendly interface for creating stunning visuals.
Traction
Over 5,000 users registered within the first week of launch.
Continuously improving features based on user feedback.
No specific revenue data provided.
Market Size
Global data visualization market size was estimated at $5.9 billion in 2020, and it is projected to reach $10.2 billion by 2025 with a CAGR of 11.6%.

AI Graph Maker
Create stunning graphs from your data in seconds using AI
8
Problem
Users manually create graphs using tools like Excel/Google Sheets, which is time-consuming and requires design expertise to select appropriate chart types, leading to inefficient data visualization.
Solution
AI-powered tool where users generate charts via AI by connecting data sources (Excel/Google Drive) or describing data needs, automatically selecting the best chart type for instant professional results.
Customers
Data analysts, business professionals, marketers, educators, and researchers needing quick, polished graphs for reports, presentations, or publications.
Unique Features
AI-driven chart type recommendations, seamless integration with Excel/Google Drive, zero-sign-up access, and one-click theming/publishing capabilities.
User Comments
Saves hours in graph creation
Intuitive for non-designers
Accurate AI chart suggestions
Instant export for presentations
No account setup required
Traction
Featured on ProductHunt with unspecified traction metrics; highlighted for its zero-sign-up model and AI automation in demo
Market Size
The global data visualization market is projected to reach $10.2 billion by 2027 (Allied Market Research), driven by demand for automated analytics tools.

Bar Graph Generator
100% Free Bar Graph Maker Online
5
Problem
Users struggle to create bar graphs quickly without complex tools requiring time to learn and face dependency on Excel or paid software for basic data visualization.
Solution
A web-based bar graph generator allowing users to enter data and create professional charts instantly without Excel, sign-ups, or design skills. Core features: 100% free, no sign-up, and instant visualization.
Customers
Marketers, data analysts, educators, and students needing quick visual reports, presentations, or educational materials.
Alternatives
View all Bar Graph Generator alternatives →
Unique Features
Simplified data entry, real-time chart rendering, and 100% free access without registration.
User Comments
Saves time compared to Excel
Perfect for non-technical users
No hidden costs or login barriers
Ideal for last-minute presentations
Intuitive interface
Traction
Launched on ProductHunt with 1,000+ upvotes and 50+ comments; 100% free with no disclosed revenue model.
Market Size
The global data visualization market is projected to reach $10.2 billion by 2026 (Source: MarketsandMarkets, 2021).