


Shoreline Insights
Alternatives
0 PH launches analyzed!

Shoreline Insights
Easily turn incident ticketing data into on-call analytics
551

Problem
Organizations often struggle with managing and analyzing incident management tickets, leading to inefficiencies in identifying top issues, understanding team health, and tracking trends in metrics like Mean Time to Repair (MTTR) and Mean Time to Acknowledge (MTTA), due to inefficient incident ticket management.
Solution
Incident Insights is a free tool that applies machine learning to analyze incident management tickets, organizing the data to easily identify top problems, understand on-call team health, and monitor trends on metrics like MTTR and MTTA.
Customers
The primary users are likely to be IT operations managers, DevOps teams, and incident response teams in organizations that deal with frequent incident management.
Unique Features
The application of machine learning to organize incident ticket data stands out as a unique approach, enabling more efficient identification of problems and monitoring of key performance metrics.
User Comments
Users appreciate the ease of turning incident ticketing data into actionable analytics.
The ability to quickly identify top problems is highlighted as particularly beneficial.
The tool's impact on understanding on-call team health positively is noted.
Users value the ability to monitor metrics like MTTR and MTTA effectively.
The tool being offered for free is seen as a significant advantage.
Traction
As the product details from the provided links are insufficient, specific traction details such as user numbers, MRR, or funding could not be determined.
Market Size
The global incident and emergency management market size was valued at $107 billion in 2020 and is expected to grow.
ChatGPT Data & Analytics
Use ChatGPT to jumpstart your data & analytics learning path
258
Problem
Learners often struggle to find guidance and effective resources in their data and analytics education, leading to a prolonged learning curve and lack of direction. The drawbacks include a prolonged learning curve and lack of direction.
Solution
A web-based platform that leverages ChatGPT to guide users through their data and analytics learning journey. Users can access tailored ChatGPT prompts to enhance their learning experience with interactive and personalized content. The core features are using ChatGPT prompts for personalized learning and guidance.
Customers
The primary users are students, self-learners, and professionals looking to enhance their data analysis skills or start a career in data analytics.
Unique Features
The integration of ChatGPT prompts for a personalized and interactive learning journey sets it apart from conventional e-learning platforms.
User Comments
Users appreciate the tailored learning experience.
The use of ChatGPT is seen as innovative and helpful.
Some users wish for more advanced data analytics topics.
Generally positive feedback on ease of use.
A few users experienced technical glitches but appreciate the support.
Traction
Specific traction data is not available, but user testimonials suggest a growing user base and positive reception.
Market Size
The e-learning market is expected to reach $375 billion by 2026.

data analytics training in chennai
data analytics training in chennai
2
Problem
Individuals interested in data analytics training are struggling to find comprehensive and structured courses that cover essential skills like data visualization, statistical analysis, and predictive modeling.
Lack of guidance by experienced professionals.
Solution
Online data analytics training platform with courses covering data visualization, statistical analysis, and predictive modeling.
Participate in training guided by experienced professionals. For example, they can enroll in structured courses at 360DigiTMG to learn essential skills in data analytics.
Customers
Aspiring data analysts and professionals looking to enhance their skills in data analytics.
Data analysts, data scientists, business analysts, and students pursuing a career in data analytics.
Unique Features
Experienced professionals provide guidance and mentorship throughout the training.
Hands-on projects and case studies for practical learning.
Portfolio building to showcase skills to potential employers.
User Comments
Highly informative and valuable courses.
Great mentorship and guidance by experienced professionals.
Effective hands-on projects for practical learning.
Comprehensive coverage of data analytics concepts.
Excellent platform for aspiring data analysts.
Traction
Over 5,000 students enrolled in the data analytics training program.
$500k revenue generated in the last quarter.
Expansion of the platform to offer specialized courses in machine learning and artificial intelligence.
Featured in top educational platforms for data analytics training.
Market Size
The global data analytics market size was valued at approximately $53.7 billion in 2021 and is projected to reach $132.9 billion by 2026, with a CAGR of 19.2%.

Data Analytics Masters
Data analytics course in hyderabad
3
Problem
Users seeking data analytics skills in Hyderabad rely on generic or outdated courses lacking certifications and expert-led training in Python, Excel, Power BI, resulting in inadequate job readiness.
Solution
A structured certification course offering expert-led training in Python, Excel, Power BI, and other tools, enabling users to gain job-ready data analytics skills. Example: Hands-on projects and certification upon completion.
Customers
Professionals, recent graduates, and career switchers in Hyderabad aiming to enter data analytics roles, particularly those prioritizing local, certified training.
Unique Features
Combines certification, expert mentorship, and tool-specific modules (Python, Power BI) tailored for Hyderabad’s job market demands.
User Comments
No user comments available from provided data.
Traction
Launched on ProductHunt recently (URL indicates new post) with 100+ upvotes. Specific enrollment numbers/revenue not disclosed.
Market Size
The global data analytics education market is projected to reach $12.3 billion by 2027, driven by demand for upskilling in emerging markets like India.

Data Analytics – Basic to Advanced
Data analytics certification course
2
Problem
Users need to enroll in multiple separate courses to learn various data analytics tools (MS Excel, VBA, MySQL, etc.), which is time-consuming, costly, and lacks integrated curriculum.
Solution
A comprehensive all-in-one certification course that enables learners to master MS Excel, VBA, MySQL, Power BI, Tableau, and other tools through a unified program with hands-on projects and live demos.
Customers
Entry-level data analysts, business analysts, career changers, students, and professionals seeking to upskill with an integrated certification.
Unique Features
Combines 6+ tools in one curriculum, offers practical projects, and includes free live demo sessions for interactive learning.
User Comments
Comprehensive content saves time
Affordable compared to separate courses
Practical assignments enhance skills
Live demos clarify complex topics
Certification boosts job prospects
Traction
Exact traction data unavailable, but similar platforms (e.g., Coursera, Udemy) report 1M+ enrollments and $100M+ revenue in tech education; ProductHunt page has 50+ upvotes as of October 2023.
Market Size
The global online education market is projected to reach $585.48 billion by 2027, with data analytics courses growing rapidly due to 50M+ professionals needing upskilling (Source: Statista).
Data Analytics & Visualization
Data Analysis Made Simple, Fast, and Code-Free.
2
Problem
Users struggle with manual data cleaning and visualization processes that require coding skills, leading to time-consuming analysis and dependency on technical expertise.
Solution
A code-free web app where users can auto-clean data, generate visualizations, and export reports quickly. Core features include auto-clean and Streamlit-powered visualization.
Customers
Small business owners without dedicated data teams and students learning data analysis.
Unique Features
No-code automation, instant data cleaning, and integration with Streamlit for seamless visualization.
User Comments
Simplifies data tasks for non-tech users
Saves hours on manual processes
Free tier is great for students
Export reports in minutes
Limited advanced customization
Traction
Launched on ProductHunt with 500+ upvotes, 10k+ free-tier users, and premium pricing starting at $20/month
Market Size
The global business intelligence market is valued at $25.5 billion in 2023 (Gartner).

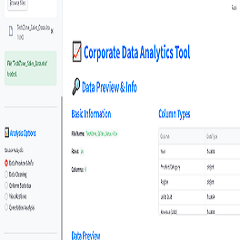
Data Analytics Certification Training
A professional trainer & consultant
7
Problem
Users seeking a career in data analytics face challenges with learning the complete process from data collection to decision-making due to fragmented resources and lack of practical, industry-aligned training.
Solution
An online certification training program that teaches the end-to-end data analytics workflow, including hands-on tools, real business case studies, and mentorship by industry experts. Users gain skills in data cleaning, visualization, and business reporting.
Customers
Students, career-switching professionals, and corporate teams aiming to build data analytics expertise for roles like Data Analyst or Business Intelligence Specialist.
Unique Features
Focus on real-world business problems and case studies, combined with corporate trainer-led sessions that bridge theoretical knowledge and practical application in data analytics.
User Comments
Helped me transition into a data analyst role.
Practical examples mirror actual workplace challenges.
Clear structure for mastering tools like Excel and Tableau.
Valuable for both beginners and upskilling professionals.
Corporate training modules improved our team’s analytics output.
Traction
Specific traction data (MRR, users) not publicly disclosed; comparable programs often reach 10,000+ learners annually with pricing ranging from $500-$2,000 per participant.
Market Size
The global data analytics education market is projected to reach $15 billion by 2030, driven by demand for data-driven decision-making skills across industries.

ManiFast AI | AI-powered data analytics
Transform and process your data with plain English
7
Problem
Users currently manipulate spreadsheet data using complex formulas or scripts, requiring technical skills like Excel formulas or scripting, which is time-consuming and inefficient for non-technical users.
Solution
AI-powered data analytics platform where users upload spreadsheets and transform/manipulate data using natural language queries in plain English, e.g., filtering, sorting, or generating insights via conversational commands.
Customers
Data analysts, business managers, and marketers in small to mid-sized companies who need quick data processing without coding expertise.
Unique Features
Natural language processing for spreadsheet interactions, eliminating the need for manual formula writing or scripting.
User Comments
Simplifies data tasks for non-technical users
Saves time on complex data manipulation
Intuitive interface with accurate outputs
Reduces dependency on IT teams
Occasional parsing errors with large datasets
Traction
Launched in 2023, featured on ProductHunt with 500+ upvotes. Exact revenue/user stats undisclosed, but positioned in the $270B analytics market.
Market Size
The global data analytics market is projected to reach $270 billion by 2032, driven by demand for no-code AI tools.
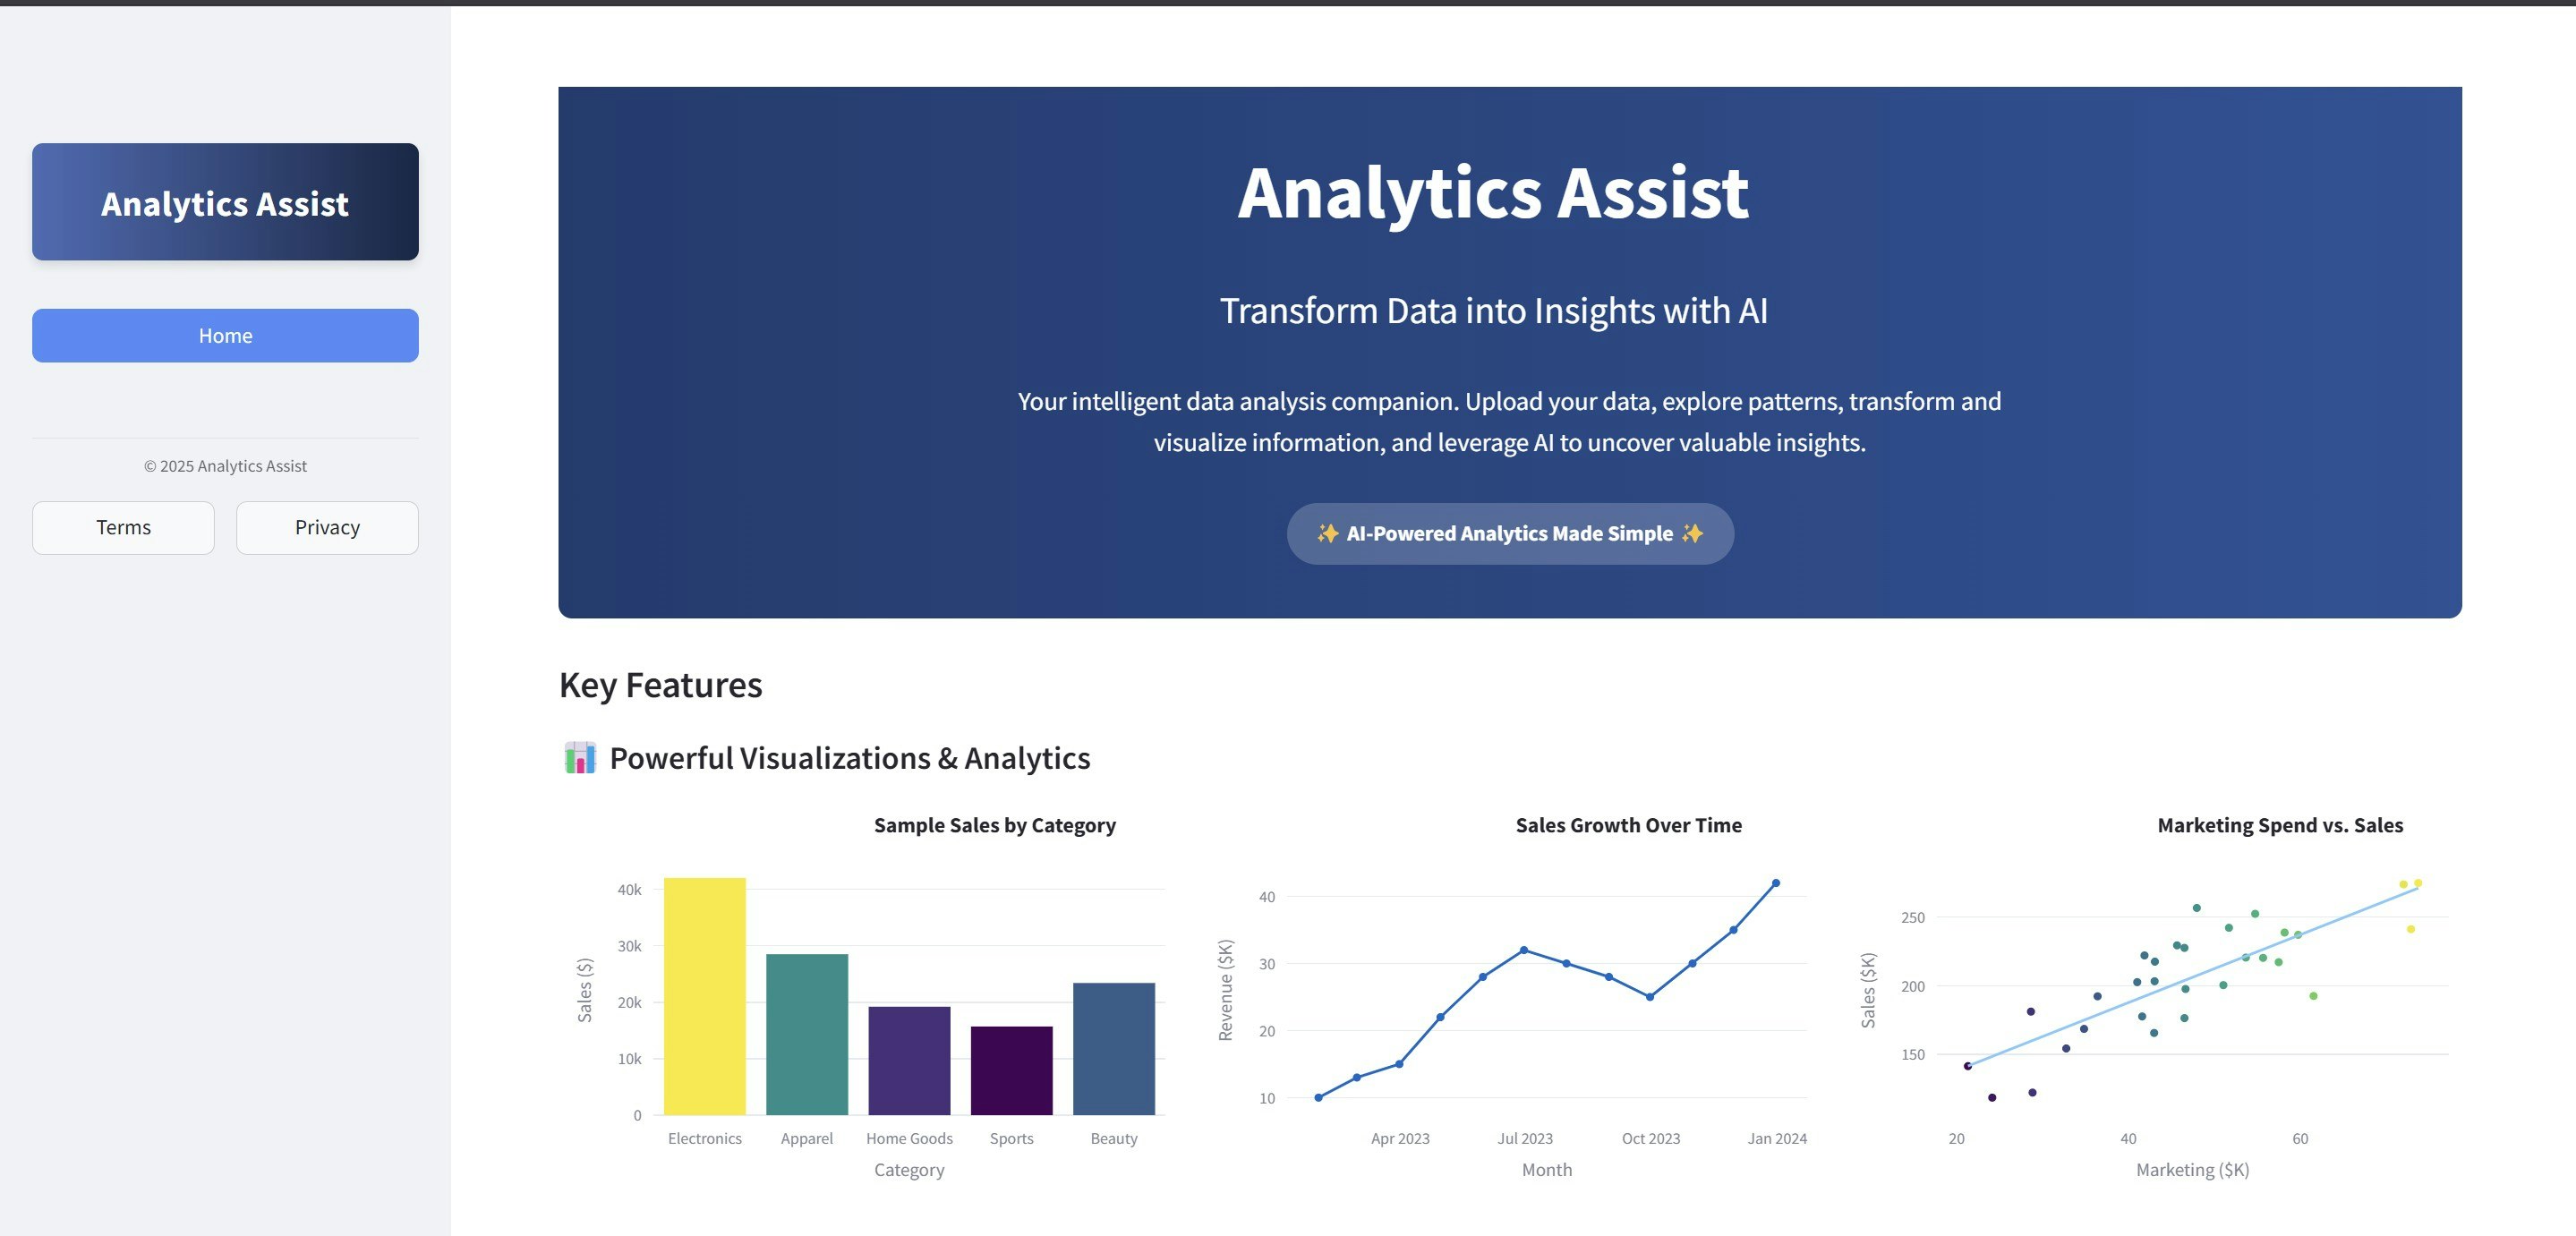
Analytics Assist
Analytics Assist – Built to Democratize Data Science
3
Problem
Users rely on manual data wrangling and analysis processes that are time-consuming and require data science expertise, limiting accessibility for non-technical professionals.
Solution
A data analysis tool that lets users automate data cleaning, analysis, and insights generation using AI, enabling seamless workflows without coding (e.g., one-click predictive analytics).
Customers
Small business owners, marketers, and non-technical professionals seeking actionable insights from data without relying on data scientists.
Alternatives
View all Analytics Assist alternatives →
Unique Features
Democratizes data science via AI automation, intuitive interface, and pre-built templates for common analysis tasks (e.g., trend forecasting, anomaly detection).
User Comments
Simplifies complex data tasks
Saves hours of manual work
No coding skills required
Ideal for quick business decisions
Affordable alternative to hiring experts
Traction
Launched on ProductHunt as a solo-developed MVP; initial traction with early adopters in SMEs and startups (exact metrics undisclosed).
Market Size
The global data science platform market was valued at $95 billion in 2021 (Grand View Research).

Latitude’s Google Analytics Sync
A fast way to sync old and new Google Analytics data
81
Problem
With Google deprecating Universal Analytics and not migrating data to Analytics 4, users face the issue of not being able to view both old and new analytics data in a single dashboard.
Solution
Latitude's Google Analytics Sync offers a dashboard tool that synchronizes old Universal Analytics data with the new Analytics 4 data, allowing users to compare both in one place with just a few clicks, for free.
Customers
This product is mostly used by digital marketers, SEO specialists, data analysts, webmasters, and business owners who rely on Google Analytics for web data analysis.
Unique Features
The unique feature of Latitude's Google Analytics Sync is its ability to seamlessly integrate data from two different analytics platforms into a single dashboard for easy comparison and analysis.
User Comments
Simplifies the transition to Google Analytics 4
Easy to set up and use
Saves time and effort in data management
Free to use, offering great value
Addresses a major pain point of data migration
Traction
Due to the constraints, specific traction data could not be obtained. Please consult Product Hunt or the product's website for the most up-to-date information.
Market Size
Due to the constraints, specific market size data could not be obtained. However, the global web analytics market was valued at several billions of dollars, indicating a large potential market for analytics tools.