


Screen Size Checker
Alternatives
0 PH launches analyzed!
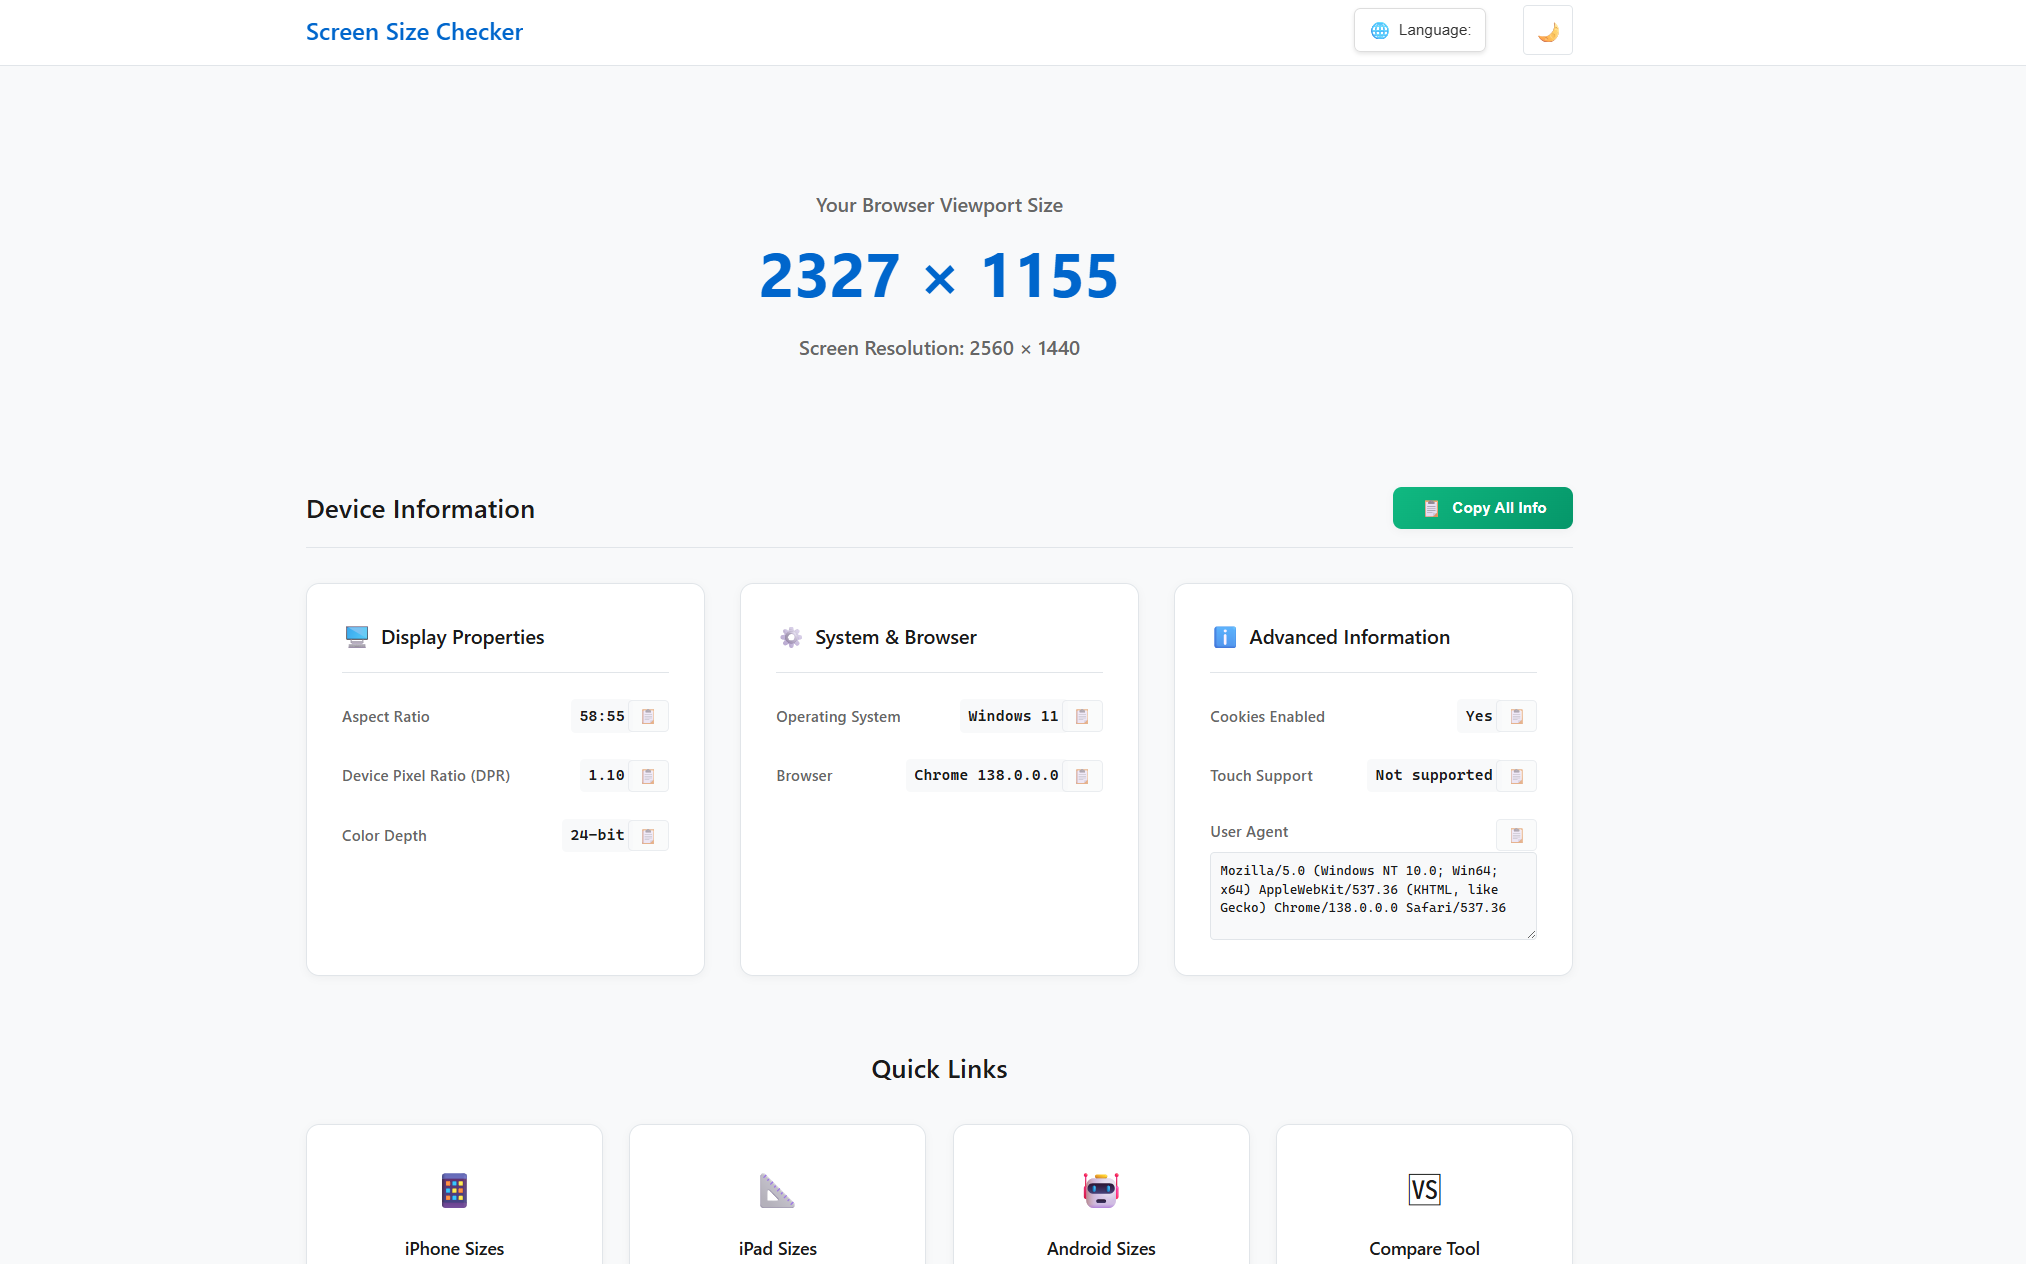
Screen Size Checker
The dev's dashboard for all screen & viewport data.
2

Problem
Users rely on outdated tools to gather display data, leading to inefficient access to real-time viewport size, DPR, and responsive testing capabilities.
Solution
A dashboard tool that provides real-time display metrics. Users can view viewport size, device pixel ratio (DPR), and test website responsiveness in a modern Bento UI interface.
Customers
Developers and designers working on web projects, particularly those focused on responsive design and cross-device compatibility.
Unique Features
Real-time display data updates, integrated responsiveness testing, free access, and a sleek Bento UI optimized for quick insights.
User Comments
Saves time debugging responsive layouts
Intuitive interface for checking DPR
Essential for cross-browser testing
Free alternative to paid tools
Modern design stands out
Traction
Launched in 2023, featured on ProductHunt with 200+ upvotes. Active user base of 10k+ developers and designers, free tier with premium features in development.
Market Size
The global web development tools market is valued at $11.6 billion (2023), with responsive design tools being a critical segment.

Problem
Users currently struggle to analyze data due to the need for SQL or coding knowledge, leading to inefficiencies and increased complexity in data analysis processes.
Solution
Parse.dev is a dashboard tool that allows users to connect any data source, ask questions in plain English, build live dashboards, and integrate with popular databases and public APIs to simplify data analysis without requiring SQL or coding.
Customers
Data analysts, business analysts, and non-technical users in various industries seeking to effortlessly analyze and visualize data without deep technical expertise.
Unique Features
The ability to ask questions in plain English and connect to any data source without requiring SQL or coding stands out as a unique feature.
User Comments
Significantly reduces the learning curve for data analysis.
Great tool for quick insights without the need for technical expertise.
Lives up to the promise of simplifying data analysis.
Some users wish for more complex analysis features.
Positive feedback on the user-friendly interface.
Traction
As of the last update, specific traction data such as the number of users, MRR, or financing details were not publicly available.
Market Size
The global data analytics market size was valued at $198.08 billion in 2020 and is expected to grow.

Salesforce TV Dashboards
Show live Salesforce dashboards on any screen
6
Problem
Users currently display Salesforce dashboards manually on office screens, which is time-consuming and lacks real-time updates, leading to outdated data visibility.
Solution
A dashboard tool where users can integrate live Salesforce dashboards, reports, and KPIs into playlists, mix them with other app content, and schedule displays for TVs/monitors.
Customers
Sales managers, sales operations teams, and business leaders needing real-time pipeline visibility and data-driven decision-making.
Unique Features
Seamless Salesforce integration, multi-app content blending, scheduled playlists, and centralized control for live dashboard displays.
User Comments
Saves time updating screens
Improves team focus on KPIs
Easy to set up playlists
Real-time data clarity
Enhances sales meeting efficiency
Traction
Launched on ProductHunt with 500+ upvotes
Used by 1k+ teams globally
Exact MRR undisclosed but active Salesforce AppExchange integration.
Market Size
The global business intelligence market is valued at $25.4 billion in 2023 (Statista), with real-time dashboard tools being a key growth segment.

Presenton: Data Presentations
Generate presentation from data reports and dashboard images
239
Problem
Users need to create compelling presentations from their complex data reports and dashboard images
Manual creation of presentations from raw data and reports is time-consuming and requires design skills
Solution
A tool that transforms PDF reports or dashboard screenshots into stunning presentations
extracts and visualizes your data with custom themes, allowing users to generate presentations immediately
Customers
Data analysts, managers, marketing professionals, and business consultants who regularly present data insights and reports to stakeholders
These individuals are often tasked with compressing large datasets into easily understandable formats and require tools that facilitate quick presentation creation
Unique Features
Transforms PDF and screenshot data into presentations quickly
Custom themes for personalized presentation styles
Focuses on ease of use, saving time in presentation preparation
User Comments
Saves a significant amount of time in creating presentations
User-friendly and intuitive interface
Great for professionals who handle extensive data
Customization options are very helpful
Some users find the initial setup and learning curve challenging
Traction
Recently launched with growing user interest
Features focused on time-saving and ease of use
Presence on ProductHunt suggests active promotion and community engagement
Market Size
The global presentation software market was valued at $1.1 billion in 2020 and is expected to continue growing as data visualization and presentation tools gain traction across various sectors

Curtain MonGuard Screen Watermark
Prevent data leaks caused by unauthorized screen capturing.
6
Problem
Users face data security risks with unauthorized screen captures.
The old solution allows screen captures without protective watermarks, leading to data leaks.
Solution
A tool to enhance data security on screens.
Curtain MonGuard prevents unauthorized screen captures by adding watermarks with user information.
Prevents data leaks and protects sensitive information.
Customers
IT security professionals, data managers, organizations concerned with information security, financial institutions, and government agencies.
The users likely involve in sectors handling sensitive data and look for preventative measures against leaks.
Unique Features
Screen watermarking with user-specific information to prevent unauthorized sharing.
Real-time application to prevent data leaks at the point of display.
Market Size
The global data loss prevention market size was valued at $1.97 billion in 2020 and is projected to grow significantly.

Excel Dashboard Ai
From Data to Report with Ai in seconds
95
Problem
Users struggle to transform Excel files into data dashboards and analysis reports efficiently, spending extensive time on data analysis and report writing. The process is often manual, slow, and prone to errors, which hampers productivity and efficiency.
Solution
Excel Dashboard Ai is a data assistant tool that instantly transforms Excel files into data dashboards and analysis reports. With this tool, users can automate the process of data analysis and reporting, significantly reducing the time and effort required to generate valuable insights from Excel data.
Customers
Business analysts, data scientists, and professionals who regularly work with large sets of Excel data and need to generate reports and dashboards swiftly. Business analysts are the primary users.
Alternatives
View all Excel Dashboard Ai alternatives →
Unique Features
The unique feature of Excel Dashboard AI is its capability to automate the entire process of converting raw Excel data into comprehensive, visually appealing dashboards and detailed analysis reports within seconds.
User Comments
Easy to use and incredibly fast.
Saves countless hours on data analysis.
Highly efficient in generating reports from raw data.
Must-have tool for anyone dealing with large Excel files.
The automation features are a game changer.
Traction
After its launch on Product Hunt, Excel Dashboard AI quickly gained attention, accumulating hundreds of upvotes and positive reviews. The product is in its early stages but shows significant potential for growth.
Market Size
The global data visualization market is expected to grow significantly, valued at $8.85 billion by 2026.

Datoshi – Your AI Data Buddy
From raw data to dashboards with a buddy who learns ur logic
30
Problem
Users currently handle data manually across files, databases, and documents, leading to backlogs and stale dashboards due to inefficient processes and lack of real-time updates.
Solution
AI data analysis tool where users automate data processing, generate live dashboards, and interact with data via chat. Core features include ContextLens memory graph for hallucination-free insights and real-time auto-refreshing dashboards.
Customers
Data analysts, engineers, and business intelligence professionals in data-driven teams needing efficient, accurate, and scalable data solutions.
Unique Features
ContextLens memory graph prevents hallucinations across large datasets; live dashboards auto-refresh with real-time data.
User Comments
Simplifies complex data workflows
Eliminates manual dashboard updates
Secure and reliable AI insights
Reduces data backlog effectively
Intuitive chat interface
Traction
Newly launched on ProductHunt; specific traction metrics (e.g., users, revenue) not disclosed in provided data.
Market Size
The global business intelligence market was valued at $27.42 billion in 2022 (Grand View Research).

Entropy Data
Better Data Products with Data Contracts
7
Problem
Users manage data products manually without a centralized system, leading to inconsistent data quality and fragmented access across organizations.
Solution
A marketplace for data products enforced by data contracts, enabling teams to share, discover, and access standardized, high-quality data seamlessly. Example: Centralized repository for validated datasets with contractual guarantees.
Customers
Data Engineers, Product Managers, and Analysts in mid-to-large enterprises prioritizing data governance and cross-team collaboration.

Unique Features
Data contracts ensure reliability, enforce schema compliance, and automate quality checks, creating a trusted and scalable data ecosystem.
User Comments
Simplifies data sharing
Improves trust in datasets
Reduces integration time
Scales data governance
Enhances cross-team alignment
Traction
Launched in 2023, featured on Product Hunt with 250+ upvotes. Specific revenue or user metrics not publicly disclosed.
Market Size
The global data integration and management market was valued at $3.2 billion in 2023, growing at 13% CAGR (Grand View Research).

Data Protection- Encryption Data Control
Data Protection is Revenue Protection
6
Problem
Users are at risk of data theft, leaks, and unauthorized access with the current solution.
Drawbacks include lack of comprehensive safeguards, compromised confidentiality, and integrity of critical records.
Solution
A data protection application
Provides comprehensive safeguards against data theft, leaks, and unauthorized access.
Ensures confidentiality and integrity of critical records.
Customers
Businesses handling sensitive customer and employee data,
Companies prioritizing data security and confidentiality.
Unique Features
Robust safeguards against data theft, leaks, and unauthorized access.
Comprehensive protection for critical records.
User Comments
Great product for ensuring data security!
Easy to use and effective in safeguarding sensitive information.
Provides peace of mind knowing our data is secure.
Highly recommend for businesses prioritizing data protection.
Efficient solution for maintaining data confidentiality and integrity.
Traction
Innovative product gaining traction in the market.
Positive user feedback and growing user base.
Market Size
$70.68 billion global data protection market size expected by 2028.
Increasing demand for data security solutions driving market growth.

Data Dashboard Hub Pro Plan for Websites
Gain valuable insights and optimize your website for success
9
Problem
Users struggle to manually gather and analyze data from multiple platforms such as Google Analytics 4, Google Search Console, Google PageSpeed Insights, Google Ads, and Google Sheets.
This manual process is time-consuming, prone to errors, and can lead to inefficiencies in decision-making and website optimization.
Solution
A data dashboard hub (Data Dashboard Pro) that provides users with a centralized platform to access and analyze data from various sources including Google Analytics 4, Google Search Console, Google PageSpeed Insights, Google Ads, and Google Sheets.
Users can easily monitor key metrics, track performance, identify trends, and make informed decisions to optimize their websites for success using this platform.
Customers
Website owners, digital marketers, SEO specialists, web developers, and online businesses.
Digital marketing managers, SEO specialists, and web developers looking to streamline data analysis processes and improve website performance.
Unique Features
Integration with multiple Google platforms such as Analytics, Search Console, PageSpeed Insights, and Ads for comprehensive data analysis.
Customizable dashboards for personalized data visualization and analysis.
Actionable insights and recommendations for website optimization based on data trends.
Automated data gathering and reporting to save time and improve decision-making processes.
User Comments
Easy-to-use interface with comprehensive data insights.
Saves time on data gathering and analysis tasks.
Helps in making informed decisions to optimize websites.
Useful for monitoring website performance and tracking key metrics.
Great tool for digital marketers and website owners.
Traction
Currently at 500+ active users.
Generating $20k in monthly recurring revenue (MRR).
Positive reviews and feedback from early adopters.
Market Size
The global web analytics market was valued at $3.3 billion in 2020 and is projected to reach $5.8 billion by 2026, with a CAGR of 10.1%.