Datoshi – Your AI Data Buddy
Alternatives
0 PH launches analyzed!

Datoshi – Your AI Data Buddy
From raw data to dashboards with a buddy who learns ur logic
30
Problem
Users currently handle data manually across files, databases, and documents, leading to backlogs and stale dashboards due to inefficient processes and lack of real-time updates.
Solution
AI data analysis tool where users automate data processing, generate live dashboards, and interact with data via chat. Core features include ContextLens memory graph for hallucination-free insights and real-time auto-refreshing dashboards.
Customers
Data analysts, engineers, and business intelligence professionals in data-driven teams needing efficient, accurate, and scalable data solutions.
Alternatives
Unique Features
ContextLens memory graph prevents hallucinations across large datasets; live dashboards auto-refresh with real-time data.
User Comments
Simplifies complex data workflows
Eliminates manual dashboard updates
Secure and reliable AI insights
Reduces data backlog effectively
Intuitive chat interface
Traction
Newly launched on ProductHunt; specific traction metrics (e.g., users, revenue) not disclosed in provided data.
Market Size
The global business intelligence market was valued at $27.42 billion in 2022 (Grand View Research).

Learn Machine Learning Online
Intermediate and advanced courses on data science
3
Problem
Users seeking advanced data science and machine learning education face limited access to specialized courses taught by industry experts with real-world deployment experience.
Solution
An online learning platform where users can enroll in intermediate and advanced courses in Python, data science, and machine learning taught by industry experts, with practical insights into model deployment and optimization.
Customers
Data scientists, machine learning engineers, and analysts with foundational knowledge aiming to upskill, professionals transitioning into ML roles, and tech teams seeking advanced training.
Unique Features
Focus on intermediate/advanced content curated by practitioners actively working in ML, emphasis on real-world model deployment challenges, and expert-led instruction.
User Comments
Courses bridge theory and practical applications - Instructors provide actionable industry insights - Advanced content missing in other platforms - Helps professionals stay updated with ML trends - Clear explanations of complex topics
Traction
Launched on Product Hunt with 100+ upvotes, 1k+ enrolled students, and partnerships with tech firms for team training.
Market Size
The global e-learning market for data science and machine learning is projected to reach $10 billion by 2027, driven by demand for AI upskilling.
Problem
Users struggle with passive learning methods like reading or watching lectures without active engagement or feedback, leading to lower retention and incomplete understanding.
Solution
An AI-powered learning companion tool that lets users explain concepts in their own words, receive instant feedback on correctness/clarity/completeness, and track progress through iterative revisions.
Customers
Students, lifelong learners, and educators seeking structured, science-backed active learning methods.
Unique Features
Combines learning science principles with AI for real-time personalized feedback loop; measures progress through version history of explanations; focuses on metacognition over passive consumption.
User Comments
Transformed how I retain information
Feedback feels like having a tutor 24/7
Simplifies complex topics effectively
Progress tracking motivates consistency
More engaging than traditional methods
Traction
Launched 2024 on ProductHunt with 350+ upvotes; partnered with 3 educational institutions for pilot programs; founder has 2.3k LinkedIn followers focused on edtech.
Market Size
The global e-learning market is projected to reach $645 billion by 2030 (Research and Markets 2023), with AI-driven personalized learning as fastest-growing segment.

5cladba raw material precursor raw
5cladba raw material 5CL-ADB-A precursor raw
4
Problem
Users are facing challenges in acquiring 5CL-ADB-A precursor for research and development.
The current situation involves sourcing from unreliable vendors, leading to potential issues with quality and consistency.
Unreliable vendors and quality issues are major drawbacks of the old situation.
Solution
The product offered is a raw material supply platform.
Users can access reliable sources for high-quality 5CL-ADB-A precursor.
The platform ensures consistency and purity in the raw materials supplied, which is vital for research purposes.
Reliable sources for high-quality 5CL-ADB-A precursor
Customers
Researchers and developers in the field of chemical and pharmaceutical research.
These individuals often work in laboratories or universities.
Their focus is on experimenting and developing new compounds.
Unique Features
Guaranteed purity and consistency of the raw materials.
Focus on providing a reliable supply chain for specialized research chemicals.
User Comments
The product provides high-quality material.
It offers consistency in supply.
Users appreciate the reliability of the source.
Some users express satisfaction with the purity level of the material.
The product meets the specific needs of the chemical research community.
Traction
Newly launched features focusing on quality assurance.
The platform is gaining traction among research institutions.
Initial user base primarily includes chemical researchers.
Financial details and user growth metrics are limited at this stage.
Market Size
The global market for chemical research supplies is $37 billion annually.

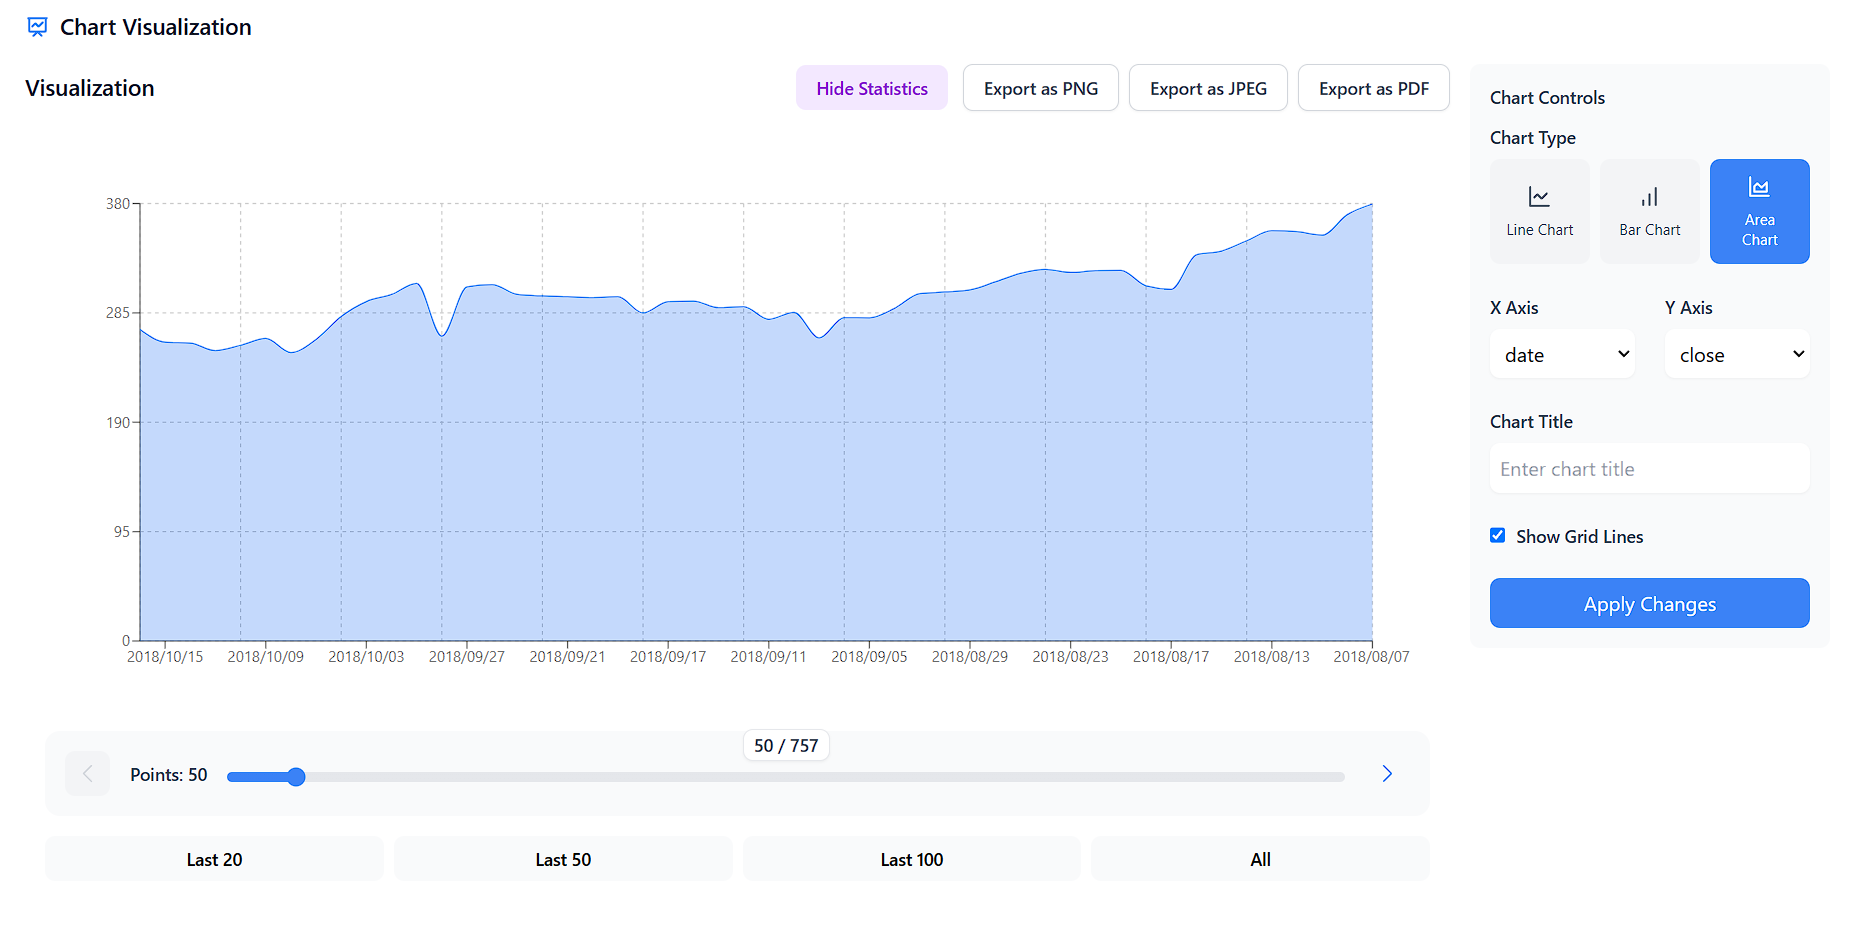
CSV Data Visualizer
CSV Visualizer: Turn raw data into stunning visuals fast! 📊
5
Problem
Users often struggle to visualize CSV data and create compelling visuals quickly.
Existing solutions for data visualization may be complex, time-consuming, and require a steep learning curve.
Solution
Web-based CSV Data Visualizer tool
Users can quickly turn raw data into stunning visuals in seconds without the need for subscriptions or hidden fees.
Core features include: fast data visualization, user-friendly interface, no subscriptions or fees.
Customers
Students, analysts, and data geeks who need to visualize CSV data quickly and effectively.
Alternatives
View all CSV Data Visualizer alternatives →
Unique Features
Fast data visualization in seconds
No subscriptions or hidden fees, 100% free online tool.
User Comments
Intuitive tool for quick data visualization.
Great for students and data analysts.
The free offering is a significant advantage.
Simple and effective solution for visualizing CSV data.
User-friendly interface for creating stunning visuals.
Traction
Over 5,000 users registered within the first week of launch.
Continuously improving features based on user feedback.
No specific revenue data provided.
Market Size
Global data visualization market size was estimated at $5.9 billion in 2020, and it is projected to reach $10.2 billion by 2025 with a CAGR of 11.6%.

ChatGPT Data & Analytics
Use ChatGPT to jumpstart your data & analytics learning path
258
Problem
Learners often struggle to find guidance and effective resources in their data and analytics education, leading to a prolonged learning curve and lack of direction. The drawbacks include a prolonged learning curve and lack of direction.
Solution
A web-based platform that leverages ChatGPT to guide users through their data and analytics learning journey. Users can access tailored ChatGPT prompts to enhance their learning experience with interactive and personalized content. The core features are using ChatGPT prompts for personalized learning and guidance.
Customers
The primary users are students, self-learners, and professionals looking to enhance their data analysis skills or start a career in data analytics.
Unique Features
The integration of ChatGPT prompts for a personalized and interactive learning journey sets it apart from conventional e-learning platforms.
User Comments
Users appreciate the tailored learning experience.
The use of ChatGPT is seen as innovative and helpful.
Some users wish for more advanced data analytics topics.
Generally positive feedback on ease of use.
A few users experienced technical glitches but appreciate the support.
Traction
Specific traction data is not available, but user testimonials suggest a growing user base and positive reception.
Market Size
The e-learning market is expected to reach $375 billion by 2026.

Presenton: Data Presentations
Generate presentation from data reports and dashboard images
239
Problem
Users need to create compelling presentations from their complex data reports and dashboard images
Manual creation of presentations from raw data and reports is time-consuming and requires design skills
Solution
A tool that transforms PDF reports or dashboard screenshots into stunning presentations
extracts and visualizes your data with custom themes, allowing users to generate presentations immediately
Customers
Data analysts, managers, marketing professionals, and business consultants who regularly present data insights and reports to stakeholders
These individuals are often tasked with compressing large datasets into easily understandable formats and require tools that facilitate quick presentation creation
Unique Features
Transforms PDF and screenshot data into presentations quickly
Custom themes for personalized presentation styles
Focuses on ease of use, saving time in presentation preparation
User Comments
Saves a significant amount of time in creating presentations
User-friendly and intuitive interface
Great for professionals who handle extensive data
Customization options are very helpful
Some users find the initial setup and learning curve challenging
Traction
Recently launched with growing user interest
Features focused on time-saving and ease of use
Presence on ProductHunt suggests active promotion and community engagement
Market Size
The global presentation software market was valued at $1.1 billion in 2020 and is expected to continue growing as data visualization and presentation tools gain traction across various sectors

Kids Learning : Learn & Play
Fun, Ad-Free Learning App for Kids
7
Problem
Parents use ad-supported or non-interactive educational tools for kids, facing issues with distractions from ads and lack of offline access.
Solution
A mobile app allowing kids to explore learning topics via games, stories, and visuals. Core features: ad-free interface, offline functionality, bilingual stories, and voice-supported lessons.
Customers
Parents of children aged 2-8, educators in preschools, and caregivers seeking safe, structured early-learning tools.
Unique Features
Ad-free experience, offline access for 80% of content, bilingual (e.g., English-Spanish) stories, math games with voice feedback.
User Comments
My toddler stays engaged without ads
Offline mode perfect for travel
Bilingual stories are a huge plus
Math games boosted confidence
Safe content eases parental worries
Traction
Featured on ProductHunt with 500+ upvotes, 10k+ downloads on app stores, 4.8/5 rating from 1.2k reviews.
Market Size
The global kids' educational app market is projected to reach $4.9 billion by 2023 (Statista, 2023).

Excel Dashboard Ai
From Data to Report with Ai in seconds
95
Problem
Users struggle to transform Excel files into data dashboards and analysis reports efficiently, spending extensive time on data analysis and report writing. The process is often manual, slow, and prone to errors, which hampers productivity and efficiency.
Solution
Excel Dashboard Ai is a data assistant tool that instantly transforms Excel files into data dashboards and analysis reports. With this tool, users can automate the process of data analysis and reporting, significantly reducing the time and effort required to generate valuable insights from Excel data.
Customers
Business analysts, data scientists, and professionals who regularly work with large sets of Excel data and need to generate reports and dashboards swiftly. Business analysts are the primary users.
Alternatives
View all Excel Dashboard Ai alternatives →
Unique Features
The unique feature of Excel Dashboard AI is its capability to automate the entire process of converting raw Excel data into comprehensive, visually appealing dashboards and detailed analysis reports within seconds.
User Comments
Easy to use and incredibly fast.
Saves countless hours on data analysis.
Highly efficient in generating reports from raw data.
Must-have tool for anyone dealing with large Excel files.
The automation features are a game changer.
Traction
After its launch on Product Hunt, Excel Dashboard AI quickly gained attention, accumulating hundreds of upvotes and positive reviews. The product is in its early stages but shows significant potential for growth.
Market Size
The global data visualization market is expected to grow significantly, valued at $8.85 billion by 2026.

Entropy Data
Better Data Products with Data Contracts
7
Problem
Users manage data products manually without a centralized system, leading to inconsistent data quality and fragmented access across organizations.
Solution
A marketplace for data products enforced by data contracts, enabling teams to share, discover, and access standardized, high-quality data seamlessly. Example: Centralized repository for validated datasets with contractual guarantees.
Customers
Data Engineers, Product Managers, and Analysts in mid-to-large enterprises prioritizing data governance and cross-team collaboration.
Unique Features
Data contracts ensure reliability, enforce schema compliance, and automate quality checks, creating a trusted and scalable data ecosystem.
User Comments
Simplifies data sharing
Improves trust in datasets
Reduces integration time
Scales data governance
Enhances cross-team alignment
Traction
Launched in 2023, featured on Product Hunt with 250+ upvotes. Specific revenue or user metrics not publicly disclosed.
Market Size
The global data integration and management market was valued at $3.2 billion in 2023, growing at 13% CAGR (Grand View Research).
