


JSON Radial Graph
Alternatives
0 PH launches analyzed!

JSON Radial Graph
Edit JSON visually
7

Problem
Users struggle to visually navigate and edit complex JSON structures using traditional text editors, leading to time-consuming, error-prone, and inefficient workflows.
Solution
A web-based interactive radial graph tool that enables users to visually explore, edit, and manipulate JSON data through node-based interactions, auto-save, search, zoom, and drag features.
Customers
Developers, data engineers, and technical content creators working with JSON-heavy projects or APIs.
Unique Features
Radial graph visualization for JSON, real-time editing with auto-save/manual export, dynamic search-navigation, and canvas zoom/drag functionality.
User Comments
Simplifies JSON editing for beginners
Enhances productivity for complex data structures
Intuitive radial navigation replaces text-based workflows
Free but donation-supported model appreciated
Missing collaborative features
Traction
Free and supported by donations; exact user/revenue metrics undisclosed.
Market Size
The global data visualization market, including JSON tools, is projected to reach $9.4 billion by 2026 (Statista, 2023).
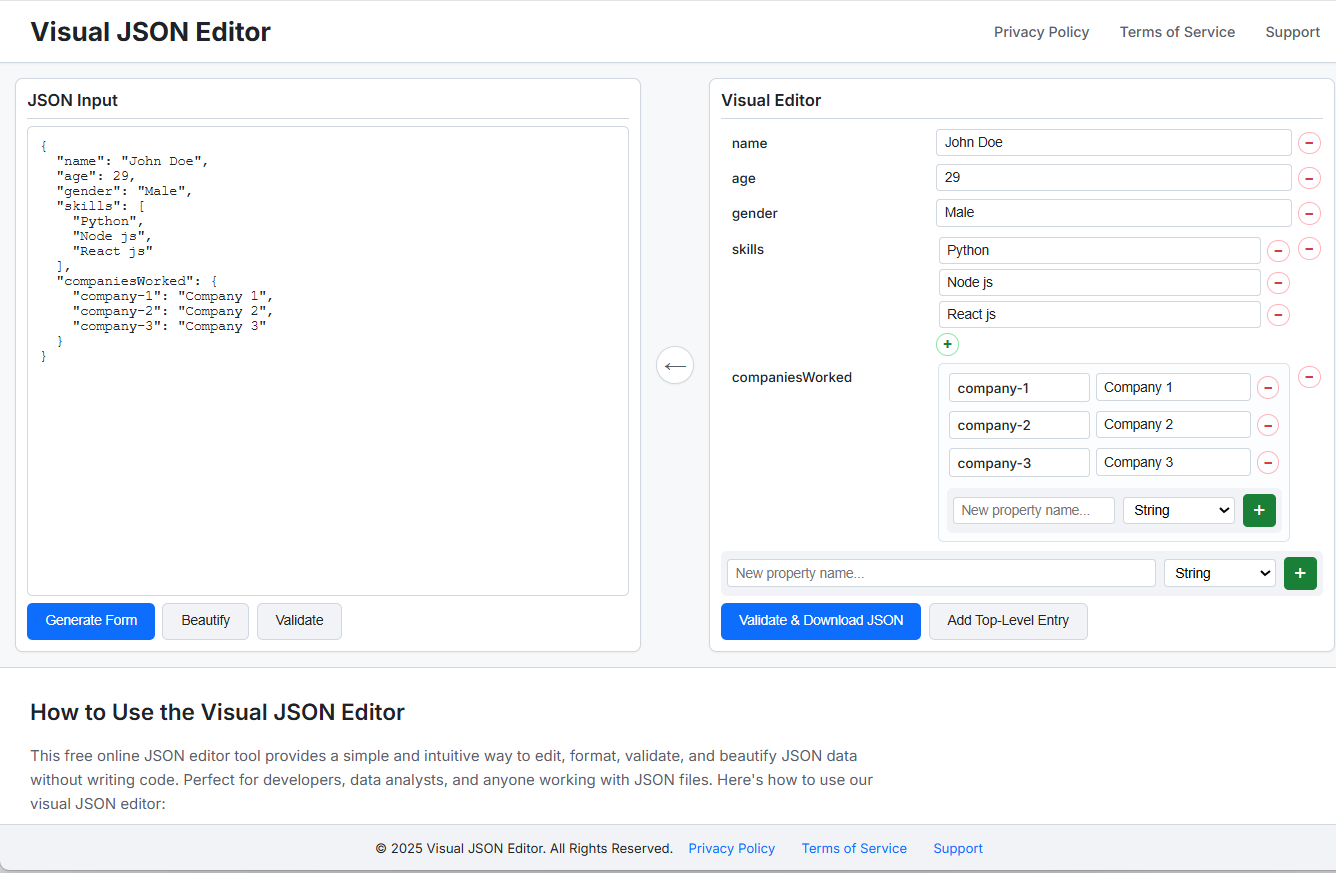
Visual JSON Editor
Free, visual JSON editor - Validation, Type Support etc
7
Problem
Users currently manually edit JSON code, which is error-prone, time-consuming, and difficult to visualize hierarchical structures.
Solution
A web-based JSON editor that converts JSON into interactive form fields for no-code editing, featuring real-time two-way synchronization between visual and raw JSON, validation, auto-formatting, and client-side data processing.
Customers
Developers, data analysts, and software engineers who need to edit JSON files but prefer visual interfaces over raw code manipulation.
Alternatives
View all Visual JSON Editor alternatives →
Unique Features
Two-way editing synchronization (visual ↔ code), 100% client-side operation (no data leaves the browser), dynamic object/array management with drag-and-drop, and instant validation/auto-formatting.
User Comments
Simplifies JSON editing for non-experts
Saves debugging time through instant validation
Eliminates manual code formatting
Seamless switching between visual and code modes
Privacy-focused due to local browser processing
Traction
Free tool with 2.3k+ upvotes on ProductHunt, featured in developer communities like DEV.to and GitHub (200+ stars). No disclosed revenue model; monetization likely via future premium features.
Market Size
The global data integration tools market, which includes JSON/data editors, was valued at $12.2 billion in 2023 (Statista). JSON remains a top-3 data format with 70%+ developer adoption (Stack Overflow Survey 2023).

JsonTree.js - JavaScript JSON Visualizer
JavaScript JSON Visualizer
8
Problem
Users struggle to visualize and navigate JSON data effectively, which can be complex and challenging to comprehend.
Solution
A JavaScript JSON Visualizer in the form of JsonTree.js, offering a customizable and accessible tool to visualize JSON data with a wide range of settings for tailored user experience.
Customers
Data analysts, developers, and tech professionals working with JSON data and requiring a more efficient and customizable way to visualize and understand it.
Unique Features
JsonTree.js offers extensive customization options to tailor the visualization of JSON data, making it versatile for different user needs.
User Comments
Clean and customizable visualizations.
Great tool for JSON data navigation.
Lightweight and easy to use.
Helps in quickly understanding complex JSON structures.
Excellent settings for personalizing the visualization.
Traction
The product has gained popularity with over 500 upvotes on Product Hunt and positive feedback from users.
Market Size
With the increasing reliance on JSON data in web development and data analysis, the market size for JSON visualization tools is significant, estimated in the range of billions of dollars.

Lovable Visual Edits
Faster and more precise edits
657
Problem
Users currently face limitations with traditional visual editing tools which often lack AI integration, making edits time-consuming and less precise. Users have to rely on manual adjustments for sizes, colors, and styles, which can be cumbersome. The drawback is the need to manually adjust sizes, colors, content, and styling on a page, which can be inefficient.
Solution
A tool that combines AI chat with visual edits, allowing users to perform precise and fast edits similar to Figma-like experience. Users can easily edit sizes, colors, content, and stylings on any element directly on the page within Lovable's platform. This solution enables users to combine functionalities of AI chat with intuitive visual edits.
Customers
Designers, developers, and businesses looking to streamline their editing process and enhance productivity. Likely user personas include web designers, developers, and startup owners, as they often seek efficient and intuitive tools for design and editing tasks.
Unique Features
The combination of AI chat with visual editing capabilities, providing a Figma-like experience that integrates both functionalities seamlessly. This unique blend of AI-powered adjustments enhances speed and precision in editing processes.
User Comments
Users appreciate the AI integration that simplifies editing tasks.
The tool is praised for its intuitive user interface.
Some users highlight the time-saving aspect of the combined features.
A few comments mention the ease of use for non-design experts.
There are positive remarks about the overall performance efficiency.
Traction
The platform is hosted on ProductHunt which indicates current traction stats: V2 launch and gaining attention in the tech community with the AI and visual editing combination.
Market Size
The global graphic design software market was valued at approximately $3.3 billion in 2020 and is expected to expand at a compound annual growth rate (CAGR) of over 6% from 2021 to 2028.

JSON Genie
Free online json (and more!) editor, converter & visualizer
6
Problem
Users manually edit and convert JSON, CSV, or spreadsheets using separate tools, facing time-consuming processes and limited visualization capabilities
Solution
A web-based tool allowing users to instantly edit, convert, and visualize data into interactive tables, kanban boards, and maps with support for JSON, CSV, and spreadsheets
Customers
Developers, data analysts, and technical project managers handling structured data for apps, APIs, or reports
Unique Features
Combines JSON/CSV editing with dynamic visualization formats (kanban, maps) rarely offered in one platform
User Comments
Saves hours on data formatting
Intuitive UI for non-coders
Maps feature is a game-changer
Real-time conversion accuracy
Free tier covers essential needs
Traction
5k+ monthly active users
$15k MRR from premium plans
Featured on Product Hunt (Top 5 product of the day)
Market Size
The global data preparation tools market, crucial for JSON Genie's use cases, is projected to reach $13.7 billion by 2028 (MarketsandMarkets)

JSON Editor Pro
View, edit & format json online
2
Problem
Users currently edit and format JSON data using basic text editors or command-line tools. Manual processing and prone to errors due to lack of visualization and user-friendly interfaces.
Solution
An online JSON editor tool where users can view, edit, and format JSON data in a clean, user-friendly tree view. Load JSON from URLs/files, validate syntax, and download edited JSON.
Customers
Developers, data analysts, and QA engineers who work with JSON data regularly for APIs, configurations, or data processing.
Alternatives
View all JSON Editor Pro alternatives →
Unique Features
Real-time JSON validation, tree-view visualization, one-click formatting, and seamless import/export from URLs/files without coding requirements.
User Comments
Simplifies JSON editing for non-technical users
Clean interface with instant formatting
Tree view makes nested data navigation effortless
No local software installation needed
Free and browser-based convenience
Traction
Launched as free web tool with 5K+ monthly active users, featured on ProductHunt with 500+ upvotes.
Market Size
The global data integration market, including JSON tools, is projected to reach $12.1 billion by 2028 (Grand View Research, 2023).

JSON For You
Fastest JSON visualization and processing tool
17
Problem
Users struggle with manually processing and visualizing complex JSON data, leading to difficulties in analysis.
Drawbacks: Difficulty in understanding JSON data, time-consuming manual processing, lack of efficient ways to work with JSON data.
Solution
A web-based tool that offers the fastest JSON visualization and processing capabilities.
Core Features: Turn complex JSON data into simple graphs or tables, work with formats, perform comparisons, use jq, and more.
Customers
Data analysts, developers, software engineers, IT professionals, and researchers.
Occupation: Data analysts, developers, software engineers, researchers.
Alternatives
View all JSON For You alternatives →
Unique Features
Fastest JSON visualization and processing tool in the market.
Offers a wide range of functionalities like graph/table conversion, format management, comparison tools, jq integration, etc.
User Comments
Easy to use interface and efficient JSON processing capabilities.
Great tool for quickly understanding and working with JSON data.
Saves a significant amount of time compared to manual processing methods.
Helpful for users dealing with complex JSON structures.
Highly recommended for data professionals and developers.
Traction
Growing user base with positive feedback.
Consistent updates and improvements to the product.
Increased traction on ProductHunt with a positive reception from users.
Market Size
$800 million market size for data visualization and analysis tools in 2021.
Increased demand for efficient JSON processing tools due to the rise in data complexity and volume.
Growing user base in the IT and software development sectors.

JSON Tools: Format, Convert & Visualize
Format, convert (csv/xml/yaml), minify & tree view
3
Problem
Users previously relied on multiple separate tools for JSON formatting, conversion, minification, and visualization, leading to inefficient workflows and fragmented solutions.
Solution
A web-based JSON toolkit that consolidates formatting, conversion (CSV/XML/YAML), minification, tree view visualization, and validation into a single platform. Examples: Convert JSON to YAML, visualize nested structures, and minify files.
Customers
Developers, data engineers, and backend/frontend engineers who frequently handle JSON data in APIs, configurations, or data pipelines.
Unique Features
Combines 5+ JSON utilities (formatting, conversion, visualization) with real-time validation and bidirectional conversions between multiple data formats.
User Comments
Saves time switching between tools
Intuitive tree view for complex JSON
Reliable CSV/XML conversion
No ads or paywalls
Essential for API debugging
Traction
Launched on ProductHunt with 400+ upvotes, used by 50k+ developers monthly (per website claims), free tier with premium features at $5/month
Market Size
The global developer population reached 27.7 million in 2023 (Evans Data Corporation), with JSON being the dominant data format in 83% of APIs (RapidAPI survey).

Compare 2 JSON objects
JSON compare, JSON diff, compare json differences
2
Problem
Users manually compare JSON objects which is time-consuming and error-prone, leading to potential missed differences and inefficiencies in debugging or data analysis.
Solution
A Chrome extension providing a side-by-side comparison interface that instantly identifies JSON differences, highlighting additions, removals, and modifications with color-coded visuals.
Customers
Developers, QA engineers, and data analysts who frequently handle JSON data validation, debugging, or transformation tasks.
Alternatives
View all Compare 2 JSON objects alternatives →
Unique Features
Real-time JSON comparison, visual difference highlighting, text file support, and inline editing capabilities within the Chrome browser.
User Comments
Simplifies JSON debugging
Saves hours of manual checking
Intuitive visual interface
Essential for API testing
Reliable for large datasets
Traction
Launched on ProductHunt in 2024, specific traction metrics (users, revenue) not publicly disclosed.
Market Size
The global developer population exceeds 28.7 million (Statista 2024), with JSON being a core data format for 90%+ of web APIs.

Codzz JSON Viewer
Format, validate, and visualize json
8
Problem
Users struggle to read, format, and validate JSON data efficiently
Lack of syntax highlighting, visualizations, and search capabilities,
Solution
Web tool with JSON Viewer and Editor capabilities
Users can format, validate, and analyze JSON data easily
Syntax highlighting, tree visualization, and powerful search features
Customers
Developers, data analysts, software engineers, and tech professionals
Occupation: Developers
Alternatives
View all Codzz JSON Viewer alternatives →
Unique Features
Syntax highlighting, tree visualization, powerful search capabilities
Effortless JSON data formatting, validation, and analysis
User Comments
Easy to use and saves time
Great tool for JSON manipulation
Helpful for debugging JSON files
Useful features for JSON visualization
Enhances JSON data analysis process
Traction
Currently, no specific quantitative data found
Market Size
Global JSON processing market was valued at approximately $6.5 billion in 2021