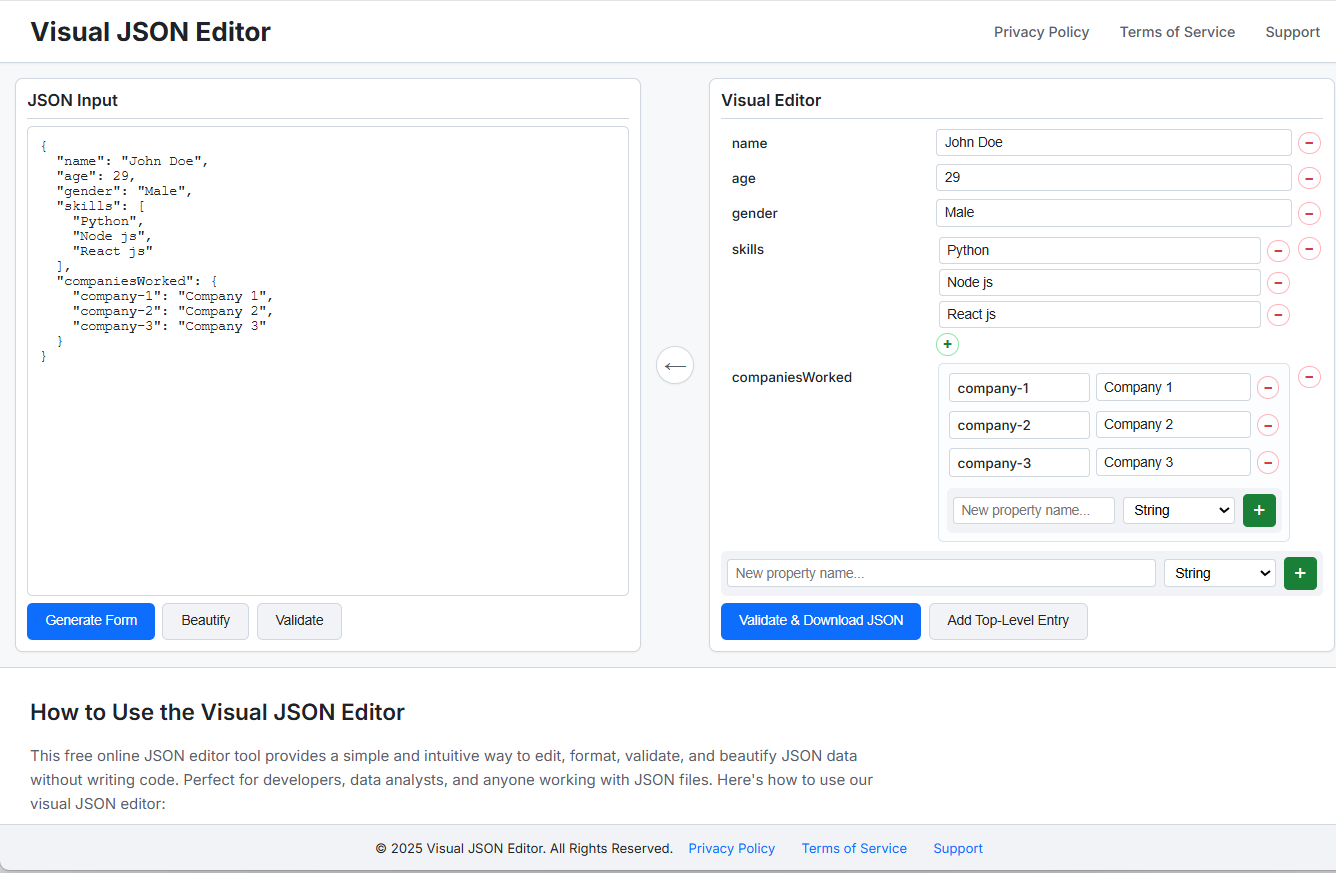
What is JSON For You?
Turn your complex JSON data into simple graphs or tables, and easily work with it using formats, comparisons, jq and more. Say goodbye to the hassle of understanding JSON and hello to JSON For You!
Problem
Users struggle with manually processing and visualizing complex JSON data, leading to difficulties in analysis.
Drawbacks: Difficulty in understanding JSON data, time-consuming manual processing, lack of efficient ways to work with JSON data.
Solution
A web-based tool that offers the fastest JSON visualization and processing capabilities.
Core Features: Turn complex JSON data into simple graphs or tables, work with formats, perform comparisons, use jq, and more.
Customers
Data analysts, developers, software engineers, IT professionals, and researchers.
Occupation: Data analysts, developers, software engineers, researchers.
Unique Features
Fastest JSON visualization and processing tool in the market.
Offers a wide range of functionalities like graph/table conversion, format management, comparison tools, jq integration, etc.
User Comments
Easy to use interface and efficient JSON processing capabilities.
Great tool for quickly understanding and working with JSON data.
Saves a significant amount of time compared to manual processing methods.
Helpful for users dealing with complex JSON structures.
Highly recommended for data professionals and developers.
Traction
Growing user base with positive feedback.
Consistent updates and improvements to the product.
Increased traction on ProductHunt with a positive reception from users.
Market Size
$800 million market size for data visualization and analysis tools in 2021.
Increased demand for efficient JSON processing tools due to the rise in data complexity and volume.
Growing user base in the IT and software development sectors.


