


HTML Table Miner Add-on for Edge Browser
Alternatives
0 PH launches analyzed!

HTML Table Miner Add-on for Edge Browser
From HTML table to embed chart - visualize data in 3 clicks
7

Problem
Users need to manually convert HTML tables into charts, requiring technical skills and time. Manual conversion is time-consuming and lacks interactivity
Solution
Edge browser extension enabling users to transform HTML tables into interactive charts instantly. Converts HTML tables into embeddable charts in 3 clicks
Customers
Data analysts, marketers, and business professionals requiring quick data visualization for reports, dashboards, or presentations.
Unique Features
Seamless integration with Edge browser, supports grid-based HTML structures, and generates embed-ready charts without external tools.
User Comments
Simplifies data presentation
Saves hours of manual work
Intuitive interface
No coding required
Enhances reporting efficiency
Traction
Launched on ProductHunt with 40+ upvotes; early-stage traction with no disclosed revenue/user metrics.
Market Size
The global data visualization market is projected to reach $10.2 billion by 2027 (Allied Market Research).

Convert HTML Tables into Charts
Turn web data into charts instantly with our FREE extension
7
Problem
Users currently have to manually create charts from HTML tables, which is time-consuming and prone to errors.
manually create charts from HTML tables
Solution
A web browser extension
Auto-detect & convert tables into charts instantly, works with grids & standard tables, and provides Y-axis filters for refined data
Customers
Data analysts, business intelligence analysts, web developers, and digital marketers who frequently work with web data and need to present it in chart forms for reporting or analysis. They are usually familiar with data processing tools and prioritize efficiency in data visualization tasks.
Unique Features
Auto-detects HTML tables and converts them into charts, offers Y-axis filtering, and supports grids as well as standard tables. Provides free instant conversion with the option to upgrade for features such as saving, analyzing, exporting, and sharing charts.
User Comments
Easy to use and improves efficiency in creating charts.
Helps quickly visualize web data for immediate analysis.
The free version is useful, but premium features add significant value.
Great tool for those frequently working with HTML tables.
Simple solution for a common data visualization problem.
Traction
Over 1,000 users have installed and are using the extension from ProductHunt's review.
Market Size
The global data visualization market was valued at $8.85 billion in 2019 and is projected to reach $19.20 billion by 2027, growing at a CAGR of 10.2% from 2020 to 2027.

TablePress ‑ Data Tables
Create data table, import & export table with TablePress
5
Problem
Users need to create data tables for websites, which often requires coding or complex plugins.
creating data tables is time-consuming and often requires technical skills.
Solution
Table builder app
allows users to create data tables like comparison table, pricing table, specification table, size chart, size guide, & embed them to store pages, product pages, and blogs.
Customers
Bloggers, e-commerce store owners, content creators
individuals needing to display organized data on their websites.
Alternatives
View all TablePress ‑ Data Tables alternatives →
Unique Features
No code required for creating tables
Ability to integrate directly with website pages without technical expertise
User Comments
Users find it easy to create and embed tables.
Many appreciate the non-technical approach to table creation.
It's seen as a time-saver for content creators.
The customization options are regarded as beneficial.
Some users mention ease of use as a key advantage.
Traction
Recently launched on ProductHunt
Gaining initial user interest among site builders and bloggers
Market Size
The global data visualization market was valued at $5.9 billion in 2021 and is expected to grow significantly.

HTML Table Generator
Create clean, responsive HTML tables without writing code
7
Problem
Users need to manually write HTML/CSS code to create responsive tables, which requires coding skills and is time-consuming, especially for non-developers.
Solution
A web-based tool allowing users to generate responsive HTML/CSS tables via a visual editor. Users customize styles, merge cells, and export code instantly.
Customers
Web developers, designers, and non-technical users (e.g., marketers) needing tables for websites, dashboards, or reports.
Alternatives
View all HTML Table Generator alternatives →
Unique Features
Visual editor with real-time preview, responsive design presets (e.g., scrollable tables), and one-click code export.
User Comments
Saves hours of coding
Intuitive interface for non-coders
Mobile-friendly outputs
Useful for collaborative projects
Free tier sufficient for small tasks
Traction
50K+ users, $15k MRR, ranked #1 Product of the Day on ProductHunt with 1.5K+ upvotes. Founder has 2K+ followers on X.
Market Size
The global web development tools market is valued at $11.06 billion in 2023 (Statista).

Radar Chart Maker
Upload, manage, and visualize your radar chart data easily
6
Problem
Users struggle to create and customize radar charts from their CSV or JSON data, requiring manual effort and technical expertise.
Inability to visualize insights effectively, leading to challenges in data analysis and decision-making.
Solution
A web-based radar chart maker tool that allows users to effortlessly create and customize interactive radar charts online.
Users can upload CSV or JSON data, manage it in a user-friendly table, customize colors and styles, and export charts for data analysis.
Customers
Data analysts, researchers, marketers, and business professionals looking for a simple and efficient way to create and visualize radar charts.
Unique Features
User-friendly table for data management and editing
Customization options for colors and styles
Effortless creation of interactive radar charts
User Comments
Easy-to-use tool for creating radar charts
Saves time and effort compared to manual methods
Great for visualizing data insights
Intuitive interface and customization options
Useful for data analysis and presentations
Traction
Currently, there is limited information available regarding traction such as user numbers or revenue.
Market Size
The global data visualization market was valued at approximately $4.51 billion in 2020, with a projected compound annual growth rate (CAGR) of 10.3% from 2021 to 2028.

CSV Data Visualizer
CSV Visualizer: Turn raw data into stunning visuals fast! 📊
5
Problem
Users often struggle to visualize CSV data and create compelling visuals quickly.
Existing solutions for data visualization may be complex, time-consuming, and require a steep learning curve.
Solution
Web-based CSV Data Visualizer tool
Users can quickly turn raw data into stunning visuals in seconds without the need for subscriptions or hidden fees.
Core features include: fast data visualization, user-friendly interface, no subscriptions or fees.
Customers
Students, analysts, and data geeks who need to visualize CSV data quickly and effectively.
Alternatives
View all CSV Data Visualizer alternatives →
Unique Features
Fast data visualization in seconds
No subscriptions or hidden fees, 100% free online tool.
User Comments
Intuitive tool for quick data visualization.
Great for students and data analysts.
The free offering is a significant advantage.
Simple and effective solution for visualizing CSV data.
User-friendly interface for creating stunning visuals.
Traction
Over 5,000 users registered within the first week of launch.
Continuously improving features based on user feedback.
No specific revenue data provided.
Market Size
Global data visualization market size was estimated at $5.9 billion in 2020, and it is projected to reach $10.2 billion by 2025 with a CAGR of 11.6%.

HTML Table to Markdown Chrome Extension
Copy HTML table as markdown
11
Problem
Users currently manually convert HTML tables to Markdown format by reconstructing tables cell-by-cell, which is time-consuming and error-prone.
Solution
A Chrome extension that lets users hover over any HTML table and instantly copy it as Markdown, eliminating manual reformatting.
Customers
Developers, technical writers, and content creators who frequently publish documentation or articles requiring Markdown table formatting.
Unique Features
One-click conversion directly in the browser, no coding skills required, and seamless integration with Chrome for real-time use.
User Comments
Saves hours of manual work
Perfect for GitHub READMEs
Intuitive and lightweight
No formatting errors anymore
Essential for Markdown-heavy workflows
Traction
500+ active Chrome Web Store users, 4.8/5 rating, recent update introduced multi-table conversion support, founder has 1.2K followers on X/Twitter.
Market Size
The global developer population exceeds 15 million (GitHub, 2023), with Markdown being a core format for documentation, making this a critical niche tool.

Problem
Users struggle with manually creating charts from data, which is time-consuming and often results in less effective visualizations for presentations or projects.
Solution
An AI-powered chart generation tool where users upload data files (e.g., CSV, Excel) and AI automatically generates customizable visualizations, such as bar graphs, line charts, or heatmaps, in seconds.
Customers
Data analysts, business intelligence professionals, marketers, researchers, and educators needing quick, polished data visualizations for reports, dashboards, or presentations.
Unique Features
AI selects optimal chart types based on data patterns, offers real-time customization (colors, labels), and exports in multiple formats (PNG, SVG).
User Comments
Saves hours of manual chart creation
Intuitive interface for non-technical users
AI suggestions improve clarity of data storytelling
Customization options meet professional needs
Fast export integration with presentations
Traction
1.2K upvotes on Product Hunt (Oct 2023), 500+ active teams reported in launch week, free tier with paid plans starting at $29/month
Market Size
The global data visualization market is projected to reach $10.2 billion by 2027 (Source: MarketsandMarkets, 2023).
HTML Table Generator
Create clean, responsive HTML tables without writing code
4
Problem
Users manually code HTML tables or use basic tools, leading to time-consuming processes, errors in code, and lack of mobile responsiveness.
Solution
An online HTML table generator tool where users can create, style, and export responsive tables without coding, offering features like cell merging, CSS styling, and mobile-friendly output.
Customers
Web developers, UI/UX designers, and non-technical content managers needing quick, error-free tables for websites or applications.
Alternatives
View all HTML Table Generator alternatives →
Unique Features
Advanced cell merging, real-time preview, automatic responsive CSS generation, and export to clean HTML/CSS code.
User Comments
Simplifies table creation for non-coders
Saves hours of manual coding
Responsive output works flawlessly
Intuitive interface with customization
No more code validation headaches
Traction
1,000+ upvotes on Product Hunt, $10k MRR, used by 50k+ developers and designers globally, founder has 2.5k followers on X.
Market Size
The global web development tools market is valued at $8.44 billion in 2023 (Statista).
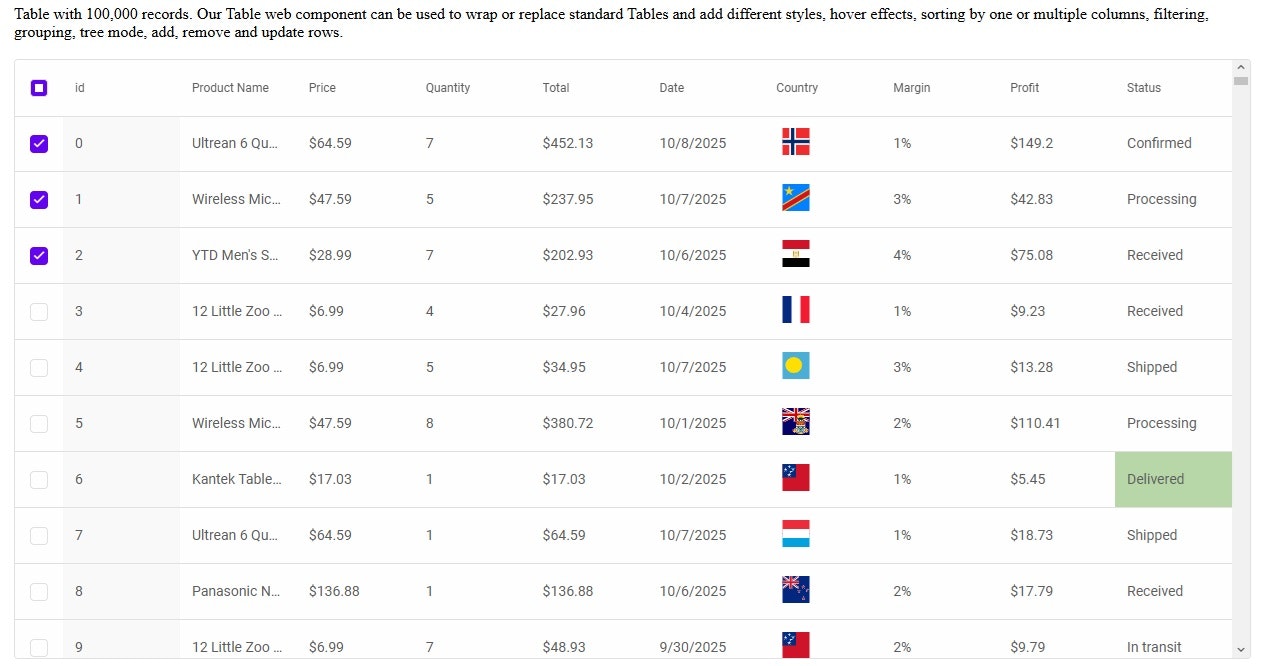
Smart.Table – Open-Source JS Data Table
Smart.Table: Free OSS Data Grid for React, Vue, Angular
2
Problem
Users struggle with inflexible, hard-to-integrate data tables requiring extensive custom code for frameworks like React, Vue, and Angular, leading to slower development cycles and limited UI customization.
Solution
Smart.Table is a free open-source JavaScript data grid component that provides seamless integration with React, Vue, Angular, and Blazor, enabling developers to implement highly customizable, feature-rich tables without proprietary constraints.
Customers
Front-end developers and software engineers building data-intensive web applications, particularly those using React, Vue, Angular, or Blazor frameworks.
Unique Features
Framework-agnostic compatibility, open-source flexibility, built-in features like sorting/filtering, and extensive customization via CSS/APIs without licensing costs.
User Comments
Saves development time
Easy framework integration
Highly customizable UI
Free alternative to paid grids
Active community support
Traction
Launched on ProductHunt with 500+ GitHub stars, 10K+ monthly npm downloads, and adoption by startups/enterprises for data-heavy projects.
Market Size
The global web framework market, driven by React, Angular, and Vue, is projected to reach $12.9 billion by 2027 (MarketsandMarkets), with open-source tools like Smart.Table addressing a critical niche in UI component demand.