Chartbrew v3
Alternatives
118,541 PH launches analyzed!

Chartbrew v3
Create connected client reports effortlessly
82
Problem
Users struggle with creating, managing, and sharing client reports because of the need to connect to multiple data sources, which often requires significant manual effort and technical know-how. The main drawbacks are the complexity and time consumption involved in integrating various data sources and creating comprehensive reports.
Solution
Chartbrew is an open-source client reporting platform that allows users to easily create, manage, and share reports by connecting to multiple data sources simultaneously. It supports various databases, Firestore, Realtime Database, APIs, and more, streamlining the report generation process.
Customers
The primary customers are data analysts, marketing professionals, and business owners who need to generate and share comprehensive client reports across different sectors.
Unique Features
The unique features of Chartbrew include its open-source nature, the ability to connect to multiple data sources simultaneously, including databases, Firestore, Realtime Database, APIs, and the provision of client accounts for easy report access.
User Comments
Users appreciate the ability to connect to multiple data sources.
They find Chartbrew user-friendly and efficient for report creation.
The open-source aspect is highly valued for customization.
Some users mention occasional glitches but overall good performance.
There is positive feedback regarding the supportive community.
Traction
Chartbrew has a growing user base but specific numbers (users, MRR/ARR, financing) were not provided; it is noted for its active development and recently launched version 3 with enhanced features.
Market Size
The global business intelligence and analytics market was valued at approximately $23.1 billion in 2020, with expectations of continued growth.

Client Campaign Report Generator
Generate Clean, Client-Ready Campaign Reports in Seconds
6
Problem
Users spend significant time manually creating campaign reports, leading to inefficiency and potential inconsistency. Manual creation of campaign reports requires extensive data compilation and formatting, which is time-consuming and prone to errors.
Solution
A web-based tool that turns your input into a professional PDF instantly via a simple form. Users input campaign data (e.g., metrics, goals) and receive a client-ready PDF without logins or dashboards.
Customers
Marketers, freelancers, and agencies who need to streamline client communication. Demographics: professionals in digital marketing, social media management, or advertising; behaviors: frequent report generation and client updates.
Unique Features
No-login instant PDF generation, minimalist interface, pre-designed templates for professionalism, and direct client-sharing capabilities.
User Comments
Saves hours on report formatting
Simplifies client communication
Professional output impresses clients
No learning curve
Affordable for small teams
Traction
Launched on ProductHunt with 500+ upvotes, 1,000+ active users, $5k MRR (estimated via pricing page: $29/month plans), founder has 1.2k followers on X.
Market Size
The global digital marketing software market is projected to reach $56 billion by 2028 (Statista, 2023), with campaign reporting tools being a critical segment.

Client Connect
Hate tracking interactions and sales two different ways?
6
Problem
Salespersons, especially freelancers, struggle to manage and track their client interactions and sales separately, leading to inefficiencies and potential loss of important information.
Solution
Client Connect is a client management system that offers a centralized platform for salespersons to manage and track their sales activities and interactions with clients. Users can easily keep track of sales and client communications in one place, streamlining their workflows and ensuring no information is lost.
Customers
Salespersons, especially freelance sales professionals, who seek a more efficient way to manage their client interactions and sales activities.
Unique Features
Centralized client management platform
Sales and interaction tracking
Integration of sales and client communication data
Streamlined workflows for sales professionals
User Comments
Easy-to-use platform for managing clients and sales interactions
Saves time and effort by consolidating sales tracking
Helps freelancers stay organized with client management
Useful tool for independent sales professionals
Improved visibility into client interactions and sales progress
Traction
Client Connect has gained significant traction with over 10,000 users actively managing their clients and sales on the platform, showing steady growth in user adoption.
Market Size
The global CRM market size was valued at approximately $43.7 billion in 2020 and is projected to reach $96.9 billion by 2028, growing at a CAGR of 10.6%.

Glow Reports
Automated business reporting, finally made effortless.
6
Problem
Users manually convert messy spreadsheets into client-ready PDFs, requiring time-consuming data cleanup and formatting, resulting in unappealing reports with limited insights.
Solution
AI-powered report generation tool that lets users upload data, describe requirements, and download visually polished, actionable PDF reports instantly (e.g., sales dashboards, financial summaries).
Customers
Consultants, analysts, and business owners needing to create frequent client-facing reports; teams handling data-heavy workflows.
Unique Features
AI transforms raw data into insights automatically; zero manual cleanup; customizable templates; one-click PDF export.
User Comments
Saves 3+ hours/week on report formatting|Improved client satisfaction with professional visuals|Easy integration with Excel/Google Sheets|AI insights add unexpected value|Limited template customization options
Traction
Launched 1 month ago on Product Hunt (1.8k+ upvotes)|300+ active users|$5k MRR|Founder has 2.5k LinkedIn followers
Market Size
The global business intelligence software market is projected to reach $33.3 billion by 2025 (Statista).

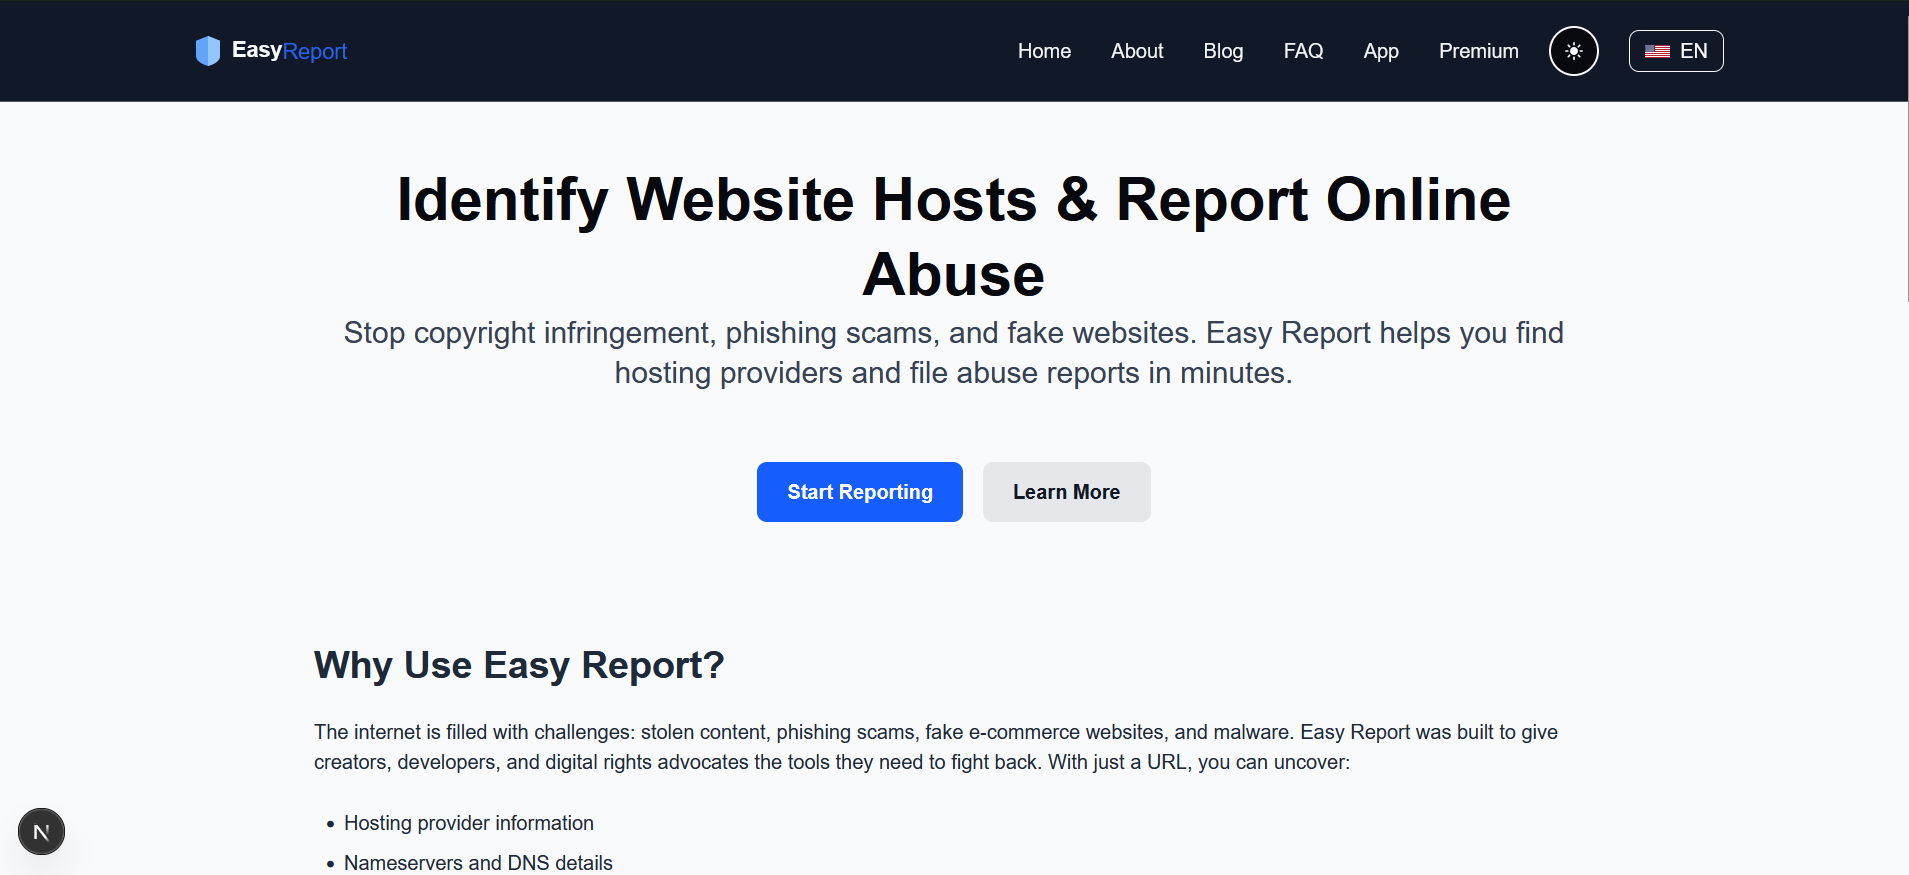
Easy Report 2.0 – Smarter Way to Report
Faster, smarter reporting with a fresh new dashboard
5
Problem
Users struggle with manual, time-consuming processes to report scams and abuse, leading to delayed responses and potential oversight of critical data due to disorganized search history and overwhelming, irrelevant insights
Solution
A user dashboard tool that centralizes scam/abuse reporting, enabling streamlined search history, faster performance, and AI-powered relevance filtering of data insights for quicker decision-making
Customers
Compliance officers, fraud analysts, and online platform moderators responsible for monitoring and mitigating digital scams/abuse
Unique Features
Context-aware data engine prioritizing high-impact insights, persistent search history for audit trails, and minimalistic interface optimized for urgency-driven workflows
User Comments
Simplifies compliance documentation
Reduces false positives in scam detection
Dashboard speeds up incident triage
Search history improves accountability
Mobile-responsive design praised
Traction
Launched 2.0 version in 2024 with upgraded analytics engine, exact user/revenue figures undisclosed but PH listing shows 280+ upvotes and active founder engagement
Market Size
The global $40.21 billion fraud detection/prevention market (Grand View Research 2023) drives demand for specialized reporting tools

Reports & Insights by NextGrowthLabs
This add-on create and manage GA4 reports in Google Sheets.
8
Problem
Users need to analyze Google Analytics 4 (GA4) data, but they struggle with extracting and integrating the data into user-friendly formats like Google Sheets. Performance and workflow can be hampered because this process is often manual and error-prone.
Common drawbacks include the inability to easily analyze and customize metrics without technical expertise, and scheduled updates for reports are not readily available.
Solution
An add-on tool for Google Sheets that allows users to effortlessly analyze GA4 data by pulling reports, customizing metrics, and scheduling automatic updates all within Google Sheets.
Customers
Marketers, data analysts, small business owners, and anyone who needs to regularly review and analyze website performance data through Google Analytics for making informed decisions.
Unique Features
This add-on facilitates the direct integration of GA4 data into Google Sheets, with capabilities for personalized metrics customization and automatic scheduling of report updates, offering a seamless workflow that may not require extensive technical know-how.
User Comments
Users find it convenient for automating GA4 data reports.
The customizable features are appreciated for detailed data analysis.
There are positive comments about the integration capability with Google Sheets.
Feedback highlights time-saving advantages due to scheduled report updates.
Users suggest minor improvements for even better functionality.
Traction
As a product on Product Hunt, measured traction details like version numbers, new features, or detailed user base statistics are not explicitly provided in the summary.
Quantitative traction data like financing, MRR, or ARR are not specified.
Market Size
The global analytics market, which includes tools like Google Analytics add-ons, was valued at approximately $25 billion in 2022 and is expected to grow as businesses continue to emphasize data-driven decision-making.

Create on-brand illustrations
Create two minute reports illustrations
8
Problem
Users need to create brand-consistent illustrations manually for marketing, websites, and social media, which is time-consuming and challenging to maintain visual coherence.
Solution
An AI-powered illustration generator tool that lets users create professional-quality, on-brand visuals in the Two Minute Reports style. Examples: generate marketing assets, social media graphics, and website illustrations using AI to ensure brand consistency.
Customers
Marketing teams, brand managers, social media managers, and content creators seeking quick, cohesive visual content without design expertise.
Unique Features
Specializes in the Two Minute Reports illustration style, AI-driven brand consistency automation, and rapid generation (2-minute turnaround).
User Comments
Saves hours on design work
Perfect for maintaining brand identity
Intuitive interface for non-designers
High-quality output for professional use
Seamless integration with marketing workflows
Traction
Newly launched on ProductHunt (June 2024), featured in top Product of the Day lists, exact user/revenue data unavailable from provided sources.
Market Size
The global $4.5 billion graphic design software market (2023) supports demand for AI-driven branding tools.
Problem
Writing company reports is time-consuming and often requires sifting through large amounts of data to extract actionable insights. The process of manually generating reports is inefficient, leading to potential delays in decision-making.
Solution
v0.report is a dashboard tool that automates the generation of insightful reports using AI. It streamlines data into decisions, allowing users to automate report creation, making business intelligence effortless.
Customers
Business analysts, managers, and executives who need to make informed decisions based on company data.
Unique Features
v0.report's unique feature is its AI-driven automation that streamlines the complexities of data analysis into easy-to-digest reports, simplifying the decision-making process.
User Comments
Users appreciate the automation and time-saving features.
The AI-driven insights are found to be highly accurate.
The interface is user-friendly and intuitive.
Some users desire more customization options in report generation.
Overall, v0.report is praised for increasing productivity in businesses.
Traction
As of my last update, there is limited available public information on v0.report’s specific traction metrics like user base or revenue. It’s a new tool showcased on ProductHunt, indicating early stage.
Market Size
The global business intelligence market size is expected to reach $33.3 billion by 2025.

NYT Connections Highlighter
Organize your Connections guesses
5
Problem
In the current situation, users playing the Connections game are organizing their guesses manually on the game board. The drawbacks of this old situation are that users struggle to easily visualize their guesses, leading to potential errors before submitting their final answers. Users have to rely on memory and manual tracking, which can be cumbersome and error-prone.
Solution
A browser extension that allows users to visually organize their Connections guesses right on the Connections game board. By right-clicking on tiles, users can create highlighted groups and easily visualize their guesses before submitting their final answers, improving accuracy and efficiency in the game.
Customers
Casual gamers and puzzle enthusiasts who play the Connections game. They are likely individuals who enjoy online games that involve pattern recognition and strategic thinking. Many will be tech-savvy and regularly use extensions or add-ons to enhance their gaming experiences.
Unique Features
The unique aspect of this product is its integration directly into the Connections game board, allowing real-time organization and visualization of guesses. This direct support through a browser extension simplifies the guessing process without requiring external tools or complicated procedures.
User Comments
Users appreciate the enhanced visualization feature.
The extension makes the game more enjoyable.
It reduces errors in guessing the Connections.
Some users find the right-click feature intuitive and easy to use.
Feedback suggests that the extension is reliable and functional.
Traction
The product is gaining traction as a newly launched feature on ProductHunt. Although specific user numbers or financial metrics are not provided, the listing and comments indicate growing interest and potential adoption among Connections game players.
Market Size
The global market for browser extension tools that enhance gaming experiences is sizeable, with the browser extension market expected to grow at a CAGR of around 7% from 2021 to 2026. While specific numbers for the gaming niche are not detailed, this market value suggests a substantial opportunity for expansion.
Problem
Users manually generate reports (PDFs, CSVs, XMLs) from multiple data sources, facing time-consuming processes and scalability challenges due to handling diverse formats and large data volumes.
Solution
An API-driven document generation tool that lets users create reusable templates and generate multiple file formats (PDFs, CSVs, XMLs) via a single API call, integrating with data sources like databases or APIs to automate scalable reporting.
Customers
Fintech and SaaS developers, technical teams requiring regulatory compliance, customer statements, or custom data exports at scale.
Unique Features
Unified API for multi-format output, asynchronous processing with Go + RabbitMQ for high concurrency, and prebuilt templates for compliance-driven industries.
User Comments
Simplifies complex report automation
Reduces development time for data exports
Scalable for high-volume use cases
Easy integration with existing systems
Supports strict regulatory requirements
Traction
Launched on ProductHunt with 100+ upvotes (as of 2023), used by undisclosed fintech clients, built on Go/RabbitMQ stack for enterprise-grade scalability.
Market Size
The global document generation software market is projected to reach $2.1 billion by 2025 (Grand View Research, 2021), driven by demand for automated compliance solutions in fintech and SaaS.

