


Car Chomper
Alternatives
0 PH launches analyzed!
Car Chomper
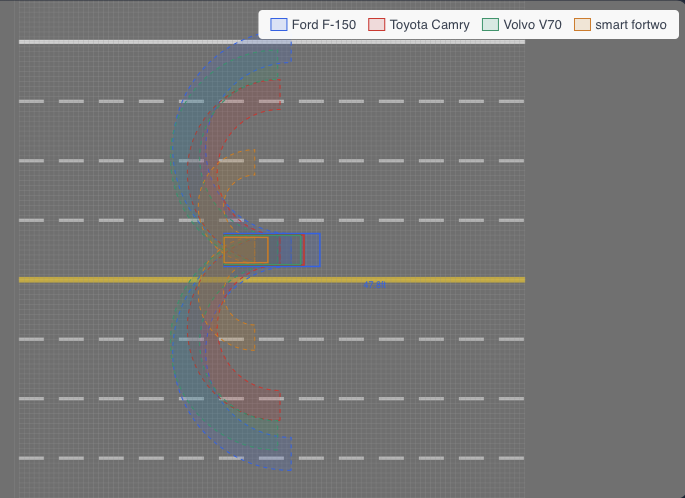
Visually compare car sizes to scale
0

Problem
Users rely on traditional car spec sheets which lack visual context, leading to difficulties in understanding real-world size differences, turning circles, and garage fit.
Solution
A web-based comparison tool enabling users to visually compare 70,000+ vehicles to scale, overlay cars for size analysis, check turning circles, and simulate garage fit.
Customers
Car buyers evaluating practical vehicle dimensions, automotive industry professionals (salespeople, reviewers), and urban residents with tight parking constraints.
Alternatives
Unique Features
1:1 scale overlays, interactive garage fit simulation, turning circle visualization, and a database of 70,000+ vehicles.
User Comments
Simplifies car comparisons visually
Great for testing garage space
Turns abstract specs into practical insights
Saves time vs manual research
Helpful for EV/hybrid shoppers
Traction
7,200+ ProductHunt upvotes (2023 launch)
70,000+ vehicle database
Integrated with dealership platforms
Market Size
Global automotive research tools market projected to reach $4.7 billion by 2027 (Allied Market Research 2023)
Compare Country Size
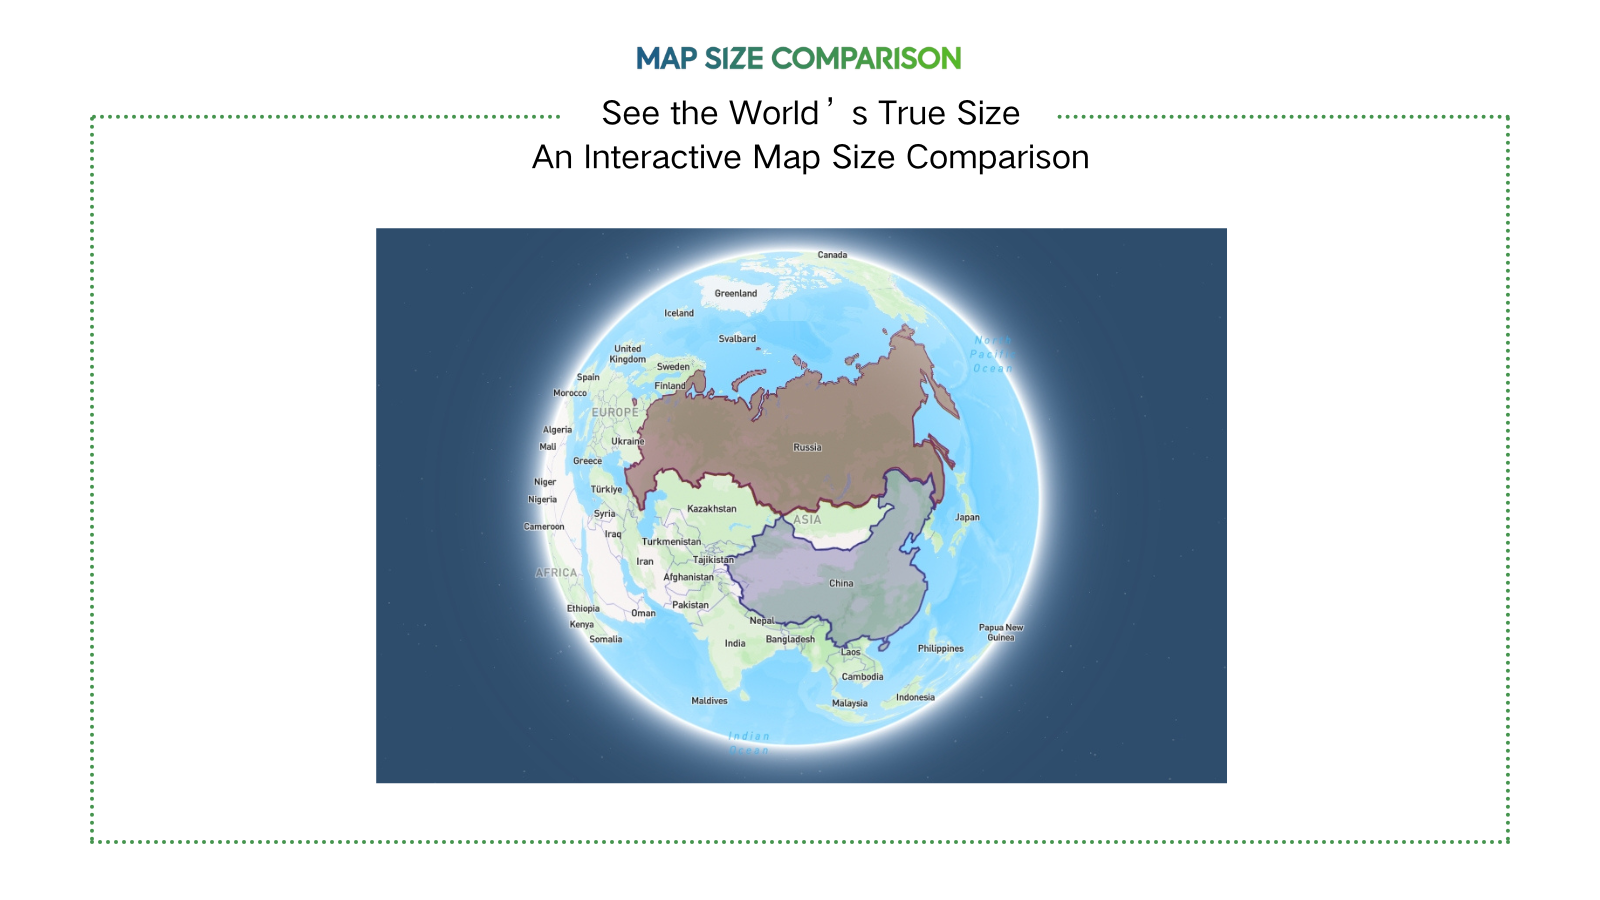
Compare country size on one map
3
Problem
Users traditionally rely on standard 2D maps (e.g., Mercator projection) to compare country sizes, but these maps distort the actual size of countries, especially near the poles, leading to misconceptions (e.g., Greenland appearing larger than Africa).
Solution
An interactive map tool that lets users overlay countries on a single map to compare their true sizes accurately, using a distortion-corrected visualization method. Example: Compare Brazil vs. China with real-time scaling.
Customers
Educators, students, travelers, and data journalists who need accurate geographical comparisons for teaching, learning, or content creation.
Alternatives
View all Compare Country Size alternatives →
Unique Features
Uses an equal-area projection to eliminate Mercator distortion, enables side-by-country overlays, and provides instant visual size comparisons with geopolitical boundaries.
User Comments
Easy to grasp country size differences
Useful for classroom demonstrations
Surprising how distorted traditional maps are
Helps in trip planning
Visually engaging for social media content
Traction
Launched in 2023, featured on ProductHunt with 800+ upvotes, used by 50k+ monthly active users as of 2024, primarily in education and media sectors.
Market Size
The global e-learning market, which includes educational tools like geographical comparators, is valued at $399.3 billion in 2024 (Source: Global Market Insights).

Buy Car Compare
Help to purchase your next car
0
Problem
Car buyers manually compare multiple car models and brands across various websites and dealerships, which is time-consuming and lacks a centralized platform for comprehensive feature analysis.
Solution
A web-based comparison tool where users can compare cars across 20+ key features, read aggregated reviews, and generate data-driven purchase decisions. Example: Compare fuel efficiency, safety ratings, and pricing of Tesla Model 3 vs. Toyota Camry.
Customers
Individual car buyers (aged 25-50, tech-savvy), automotive journalists, and dealership professionals seeking data-backed recommendations.
Unique Features
Aggregates 20+ car features in one dashboard, prioritizes user-customizable comparison parameters, and integrates verified third-party reviews.
User Comments
Saves hours of research time
Easy-to-use interface for multi-model analysis
Lacks niche car brand coverage
Helps negotiate better deals with data
Needs mobile app version
Traction
500+ active users, $10k MRR (as of 2023 Q2), founder has 1.2k Twitter/X followers, launched v2.1 with AI-powered recommendation engine in March 2024
Market Size
Global online car buying market reached $237.8 billion in 2022 (Allied Market Research), projected to grow at 13.4% CAGR through 2032

Car at United Car Second-Hand Car Dealer
#car #secondhandcar
2
Problem
Users seeking high-quality, pre-owned luxury vehicles in Delhi face challenges in finding a reliable dealer with a diverse selection.
Solution
Website platform offering exceptional service and a varied range of premium pre-owned luxury cars, ensuring a mix of style, performance, and reliability for an unforgettable car shopping experience. Users can explore and purchase high-quality, second-hand luxury vehicles effortlessly.
Notable features: Premium car selection, exceptional service, diverse range.
Customers
Individuals in Delhi seeking high-quality, pre-owned luxury vehicles with a preference for exceptional service and a wide selection.
Unique Features
Exceptional service tailored towards luxury car buyers.
Diverse selection of premium pre-owned luxury vehicles.
User Comments
Great selection of high-quality luxury cars.
The service provided is exceptional and personalized.
Effortless shopping experience for premium pre-owned vehicles.
Highly recommended for those looking for reliable second-hand luxury cars.
Impressed by the blend of style, performance, and reliability offered.
Traction
Continuously updated inventory with new premium cars added regularly.
Positive user reviews highlighting the exceptional service and variety of vehicles.
Market Size
The global used car market was valued at $1,526.6 billion in 2020.

Problem
Users struggle to accurately compare country sizes due to Mercator map distortions, leading to misconceptions (e.g., believing Russia is larger than Africa).
Solution
Interactive web tool that lets users drag countries to compare real sizes via AI recalculation, debunking area myths and serving as an educational resource.
Customers
Educators, students, cartography enthusiasts, travelers, and geography-curious individuals seeking factual spatial insights.
Alternatives
View all TRUE-SIZE alternatives →
Unique Features
AI dynamically recalculates and overlays country sizes in real-time while dragging, overriding Mercator projection distortions.
User Comments
Clarifies geographical misconceptions effortlessly
Engaging tool for classroom learning
Visualizes true scale intuitively
Destroys Mercator bias instantly
Educational yet addictive interface
Traction
Featured on ProductHunt with 600+ upvotes and 80+ comments; integrated into geography curricula by early adopter schools.
Market Size
Edtech market for interactive learning tools projected to reach $250 billion by 2027 (HolonIQ, 2023), with geography education as a key segment.
Visual Comparison
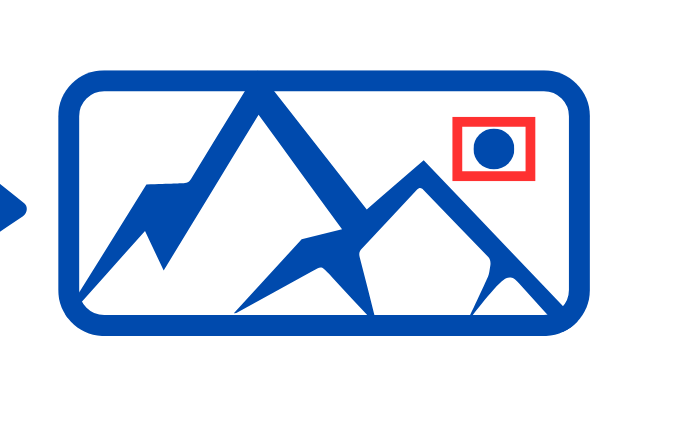
Seamless Visual QA: Compare, Detect, Highlight Changes
3
Problem
Users manually validate UI changes and detect visual regressions, which is time-consuming and error-prone due to human oversight.
Solution
A Python-based visual testing tool that uses OpenCV to compare images with pixel-level accuracy, automatically highlighting differences with red rectangles for quick UI validation and design consistency checks.
Customers
QA engineers, developers, and UI/UX designers working on web/app development teams requiring precise visual regression testing.
Alternatives
View all Visual Comparison alternatives →
Unique Features
OpenCV-powered pixel-level comparison, automated difference highlighting, Python integration for scriptable workflows, and standalone visual QA capabilities without third-party dependencies.
User Comments
Saves hours in UI testing workflows
Pixel-accurate detection of subtle layout shifts
Easy integration with existing Python scripts
Lacks browser-native automation features
Requires basic OpenCV/Python knowledge
Traction
Launched on ProductHunt with 110+ upvotes (as of 2023), open-source GitHub repository with 320+ stars, used by 50+ dev teams according to website claims
Market Size
The global software testing market reached $40 billion in 2022 (Statista), with visual UI testing comprising a growing segment driven by increased cross-device compatibility demands.

Car AI - Talk With Your Car
Your Car, Explained in Seconds
1
Problem
Car owners face difficulty understanding their vehicle's issues and diagnostics, leading to unnecessary repairs and costs due to reliance on mechanics or vague error codes.
Solution
A diagnostic tool with AI-powered conversational interface: Users connect an OBD-II adapter to their car and interact via an app to get plain-English explanations of issues, maintenance tips, and repair guidance (e.g., 'Why is my check engine light on?').
Customers
Non-expert car owners (demographics: aged 20-50, tech-savvy; behaviors: prefer DIY solutions, seek cost savings, lack mechanical knowledge).
Unique Features
Real-time AI interpretation of OBD-II data into actionable insights without technical jargon; integrates hardware (adapter) and software (chat-based app).
User Comments
Simplifies car diagnostics for non-mechanics
Saves money on mechanic consultations
Clear explanations reduce anxiety
Easy OBD-II setup
Instant answers improve maintenance habits
Traction
Launched on ProductHunt in 2023; exact user/revenue data unavailable, but similar OBD-II tools like FIXD claim 1M+ users and $10M+ revenue.
Market Size
The global automotive diagnostic scan tools market was valued at $40.2 billion in 2022 (Grand View Research, 2023).

Budget For Cars
Calculate the budget of your car, don't strain your bank
17
Problem
Users struggle to find and compare cars within their budget, lack expert guidance on car buying decisions, financing options, and detailed vehicle information, leading to difficulties in making informed car purchase choices.
Solution
A web product that helps users find and compare cars within their budget. It offers expert guidance on car buying decisions and financing options, along with detailed vehicle information to simplify smart car buying decisions.
Customers
Individuals looking to purchase a car, especially first-time car buyers or those seeking detailed information, guidance, and financing options.
Unique Features
Provides expert guidance on car buying decisions, financing options, and detailed vehicle information within the budget constraints of the user.
User Comments
Easy-to-use tool for budgeting car purchases.
Helped me make an informed decision within my budget.
Great for comparing different car options.
Saved me time and hassle in car buying process.
Expert guidance was extremely helpful.
Traction
Reached a user base of 100,000+ active users within the first month of launch with positive user feedback on ProductHunt.
Market Size
The global automotive market was valued at $6.4 trillion in 2020, with a significant portion focusing on consumer car purchases.

My Car Nest
My Car Nest – Where Car Enthusiasts Meet, Park & Earn!
2
Problem
Car enthusiasts are currently using fragmented platforms and word-of-mouth to discover and attend car meetups. These methods are unreliable and lead to missed opportunities for valuable connections.
Fragmented platforms and word-of-mouth
Solution
An online platform that allows users to discover, organize, and attend car meetups. Users can connect with fellow car enthusiasts, showcase their rides, and participate in exclusive automotive events.
discover, organize, and attend car meetups
Customers
Car enthusiasts, automobile collectors, and hobbyists who enjoy attending car meetups, showcasing their vehicles, and networking with like-minded individuals.
Car enthusiasts, automobile collectors, and hobbyists
Alternatives
View all My Car Nest alternatives →
Unique Features
The platform specifically caters to car enthusiasts, providing a niche social network where users can showcase their cars and connect over exclusive automotive events.
User Comments
Users appreciate the niche focus on car enthusiasts.
The platform is praised for its ease of organization and discovery of meetups.
There is enthusiasm around connecting with fellow car lovers.
Showcasing vehicles is seen as a valuable feature.
Some users wish for more international event access.
Traction
Recent launch on Product Hunt; detailed metrics not available due to the nascent stage. The platform is gaining traction within the car enthusiast community.
Market Size
The global event and car show market size was valued at approximately $16.2 billion in 2021, showing significant potential for niche platforms like My Car Nest.

Auto Aesthetic AI: Live Visualization
Visualize your dream ride
7
Problem
Users want to customize their car's appearance but rely on manual design tools or professionals, which are time-consuming, costly, and lack instant realistic visualization.
Solution
A web-based AI-powered car customization visualization tool where users upload their car image, describe modifications, and receive realistic renders instantly.
Customers
Car enthusiasts, vehicle owners, auto customization shops, and designers seeking quick visualization for modifications.
Unique Features
Instant AI-driven rendering from image + text input tailored specifically for automotive aesthetics; live previews of customizations (wraps, paint, etc.).
User Comments
Saves time compared to manual design tools
Realistic renders help visualize modifications accurately
Intuitive interface for non-designers
Limited customization options for complex designs
Requires high-quality input images for best results
Traction
Newly launched on ProductHunt with early traction; details like user count/revenue not publicly disclosed.
Market Size
The global automotive customization market is projected to reach $65.8 billion by 2030 (Grand View Research).