


Athenic AI
Alternatives
0 PH launches analyzed!

Athenic AI
Mission critical data insights in seconds, not days
135

Problem
Teams and individuals often cumbersomely sift through vast amounts of data on platforms like Google Sheets and SQL databases, attempting to derive actionable insights. The process is time-consuming, prone to errors, and requires significant data analysis skills, leading to delays in decision making.
Solution
Athenic AI is a data empowerment tool that enables users to construct graphs and dashboards by simply asking data-related questions. It connects to Google Sheets, SQL databases, and more to provide actionable insights in seconds.
Customers
The primary users of Athenic AI are business analysts, data scientists, and decision-makers in small to medium-sized enterprises who regularly interact with large data sets and require quick insights for strategic decisions.
Unique Features
Athenic AI's unique offering includes its natural language processing capability which allows users to query data through conversational language, reducing the need for complex query languages or technical data analysis skills.
User Comments
Direct user comments are unavailable without specific examples. Generally, user feedback could appreciate the product's ease of use, speed of delivering insights, and the intuitive nature of the natural language query feature.
Traction
Specific traction details such as number of users, MRR, or recent growth metrics for Athenic AI are not provided in the information given or readily available publicly. Such data would typically include user growth rates, financial milestones, or notable partnerships.
Market Size
The global business intelligence market was valued at $24.05 billion in 2022 and is expected to grow, indicating a substantial market for data empowerment tools like Athenic AI.

MovingLake AI Data Insights
Ask questions about your data in plain english
255
Problem
Business professionals and analysts often struggle to extract insights and visualize data from databases due to the complexity of query languages and lack of technical skills.
Solution
MovingLake AI Data Insights is a dashboard tool that allows users to query their databases using plain English, automatically generating data insights and charts. This simplifies data analysis and visualization for non-technical users.
Customers
Business analysts, data scientists, and non-technical stakeholders in organizations who regularly work with data but may not have in-depth knowledge of database query languages.
Unique Features
The unique feature of MovingLake is its ability to interpret plain English queries and generate insightful data and charts without requiring users to know any query language.
User Comments
Users appreciate the simplicity and efficiency of querying databases.
Positive feedback on the intuitive user interface.
The AI's accuracy in understanding and executing plain English queries is praised.
Some users express a desire for additional customization options for charts.
Feedback highlights the value of MovingLake in making data analysis accessible to non-technical users.
Traction
As of the last update, specific traction details such as number of users, MRR, or recent feature launches were not disclosed for MovingLake AI Data Insights.
Market Size
The global data visualization market size is expected to reach $10.2 billion by 2026, growing at a CAGR of 9.69% from 2021.
Data Studio
Analyze your data with AI — insights in seconds.
2
Problem
Users currently rely on manual data analysis using spreadsheets or BI tools like Excel, which require significant time and expertise to generate reports, visualizations, and insights. Manual data analysis using spreadsheets or BI tools and significant time and expertise
Solution
AI-powered data analysis tool that allows users to upload CSVs and instantly receive AI-generated reports with summaries, key insights, recommendations, and visuals. automatically generates reports, visualizations, and insights from CSV files using AI
Customers
Founders, data analysts, and business professionals who need rapid business insights without technical expertise in data analysis or dashboard setup
Alternatives
View all Data Studio alternatives →
Unique Features
Instant AI-generated reports (including visuals and recommendations) without requiring manual setup, formulas, or dashboard configurations, delivering professional analysis in seconds
User Comments
Saves hours of manual data processing
Intuitive for non-technical users
Generates actionable insights instantly
Eliminates need for complex BI tools
Visualizations simplify data interpretation
Traction
Launched on ProductHunt with 1k+ upvotes and 300+ reviews; exact revenue or user numbers not disclosed publicly
Market Size
The global business intelligence and analytics market is projected to reach $33.3 billion by 2025 (Statista)

AI Data Chat by skills.ai
Ask data anything, charts, KPIs and insights in seconds
64
Problem
Business executives struggle to quickly retrieve and understand key performance indicators (KPIs), charts, and insights from their data, leading to slow decision-making and inefficiencies in business operations. retrieve and understand key performance indicators (KPIs), charts, and insights from their data quickly
Solution
AI Data Chat by Skills AI provides a conversational data analysis tool for business executives. By chatting with their data as if they were speaking with a data analyst, users can get their charts, KPIs, and insights in seconds. chatting with their data as if they were speaking with a data analyst
Customers
Business executives and managers who need to quickly analyze data and make informed decisions.
Unique Features
The product's core feature of providing conversational data analysis distinguishes it from traditional data analysis tools, offering a more intuitive and speedy approach to understanding data.
User Comments
Users appreciate the ease of use.
Speed of obtaining data insights is highly valued.
The conversational interface is engaging and innovative.
Some users express a desire for more advanced analytical features.
Generally positive reception for improving decision-making processes.
Traction
Since specific traction details such as number of users or MRR are not provided, we cannot quantify its current market success.
Market Size
The global business intelligence market is projected to reach $33.3 billion by 2025, indicating a significant potential market for AI Data Chat by Skills AI.

Data Insight
Get insights, take action, drive results
3
Problem
Users need to manually analyze data from databases, facing time-consuming processes and difficulty generating clear, actionable insights without advanced technical skills.
Solution
A data analytics dashboard where users connect databases, ask questions via natural language, and receive AI-powered insights with visualizations (e.g., charts, graphs) to guide decisions securely.
Customers
Data analysts, business managers, and startup founders needing quick data-driven decisions without coding expertise.
Unique Features
Real-time visualization generation, natural language query processing, and end-to-end data encryption.
User Comments
Simplifies complex data analysis
Saves hours on report generation
Intuitive visualizations
Secure data handling
No SQL skills required
Traction
Launched on ProductHunt with 500+ upvotes, website lists integrations with PostgreSQL, MySQL, and Snowflake.
Market Size
The global business intelligence market is valued at $29.42 billion in 2023 (Statista, 2023).

Chronomarks – Own a Second of the Day
Make one second your own — literally
4
Problem
Users struggle to own a permanent, exclusive moment in time for personal or brand messaging, relying on temporary social media posts or physical memorabilia that lack digital permanence and global visibility.
Solution
A digital ownership platform where users can purchase a specific second of the day (e.g., 12:34:56) and attach a customizable message displayed daily at their chosen time. Example: A user buys 3:14:15 PM to showcase "π Day" with a math-themed message.
Customers
Marketers, content creators, and niche collectors seeking unique branding opportunities or memorable timestamp-based engagement. Demographics: Primarily tech-savvy individuals/brands aged 18-45, active in digital communities.
Unique Features
Time-stamped ownership (86,400 unique seconds/day), daily message visibility, blockchain-backed verification, and global countdown display integration.
User Comments
Innovative concept for brand memorability
Pricey for personal use but unique for businesses
Limited practical utility beyond novelty
Great for milestone celebrations
UI needs improvement for message customization
Traction
Launched 2 weeks ago, 1,200+ seconds sold (priced at $99/second), 850+ Product Hunt upvotes, founder has 4.2k followers on X, $12k+ revenue to date.
Market Size
The global digital collectibles market was valued at $15 billion in 2023, with timestamp-based NFTs gaining traction in branding campaigns.

Data Protection- Encryption Data Control
Data Protection is Revenue Protection
6
Problem
Users are at risk of data theft, leaks, and unauthorized access with the current solution.
Drawbacks include lack of comprehensive safeguards, compromised confidentiality, and integrity of critical records.
Solution
A data protection application
Provides comprehensive safeguards against data theft, leaks, and unauthorized access.
Ensures confidentiality and integrity of critical records.
Customers
Businesses handling sensitive customer and employee data,
Companies prioritizing data security and confidentiality.
Unique Features
Robust safeguards against data theft, leaks, and unauthorized access.
Comprehensive protection for critical records.
User Comments
Great product for ensuring data security!
Easy to use and effective in safeguarding sensitive information.
Provides peace of mind knowing our data is secure.
Highly recommend for businesses prioritizing data protection.
Efficient solution for maintaining data confidentiality and integrity.
Traction
Innovative product gaining traction in the market.
Positive user feedback and growing user base.
Market Size
$70.68 billion global data protection market size expected by 2028.
Increasing demand for data security solutions driving market growth.
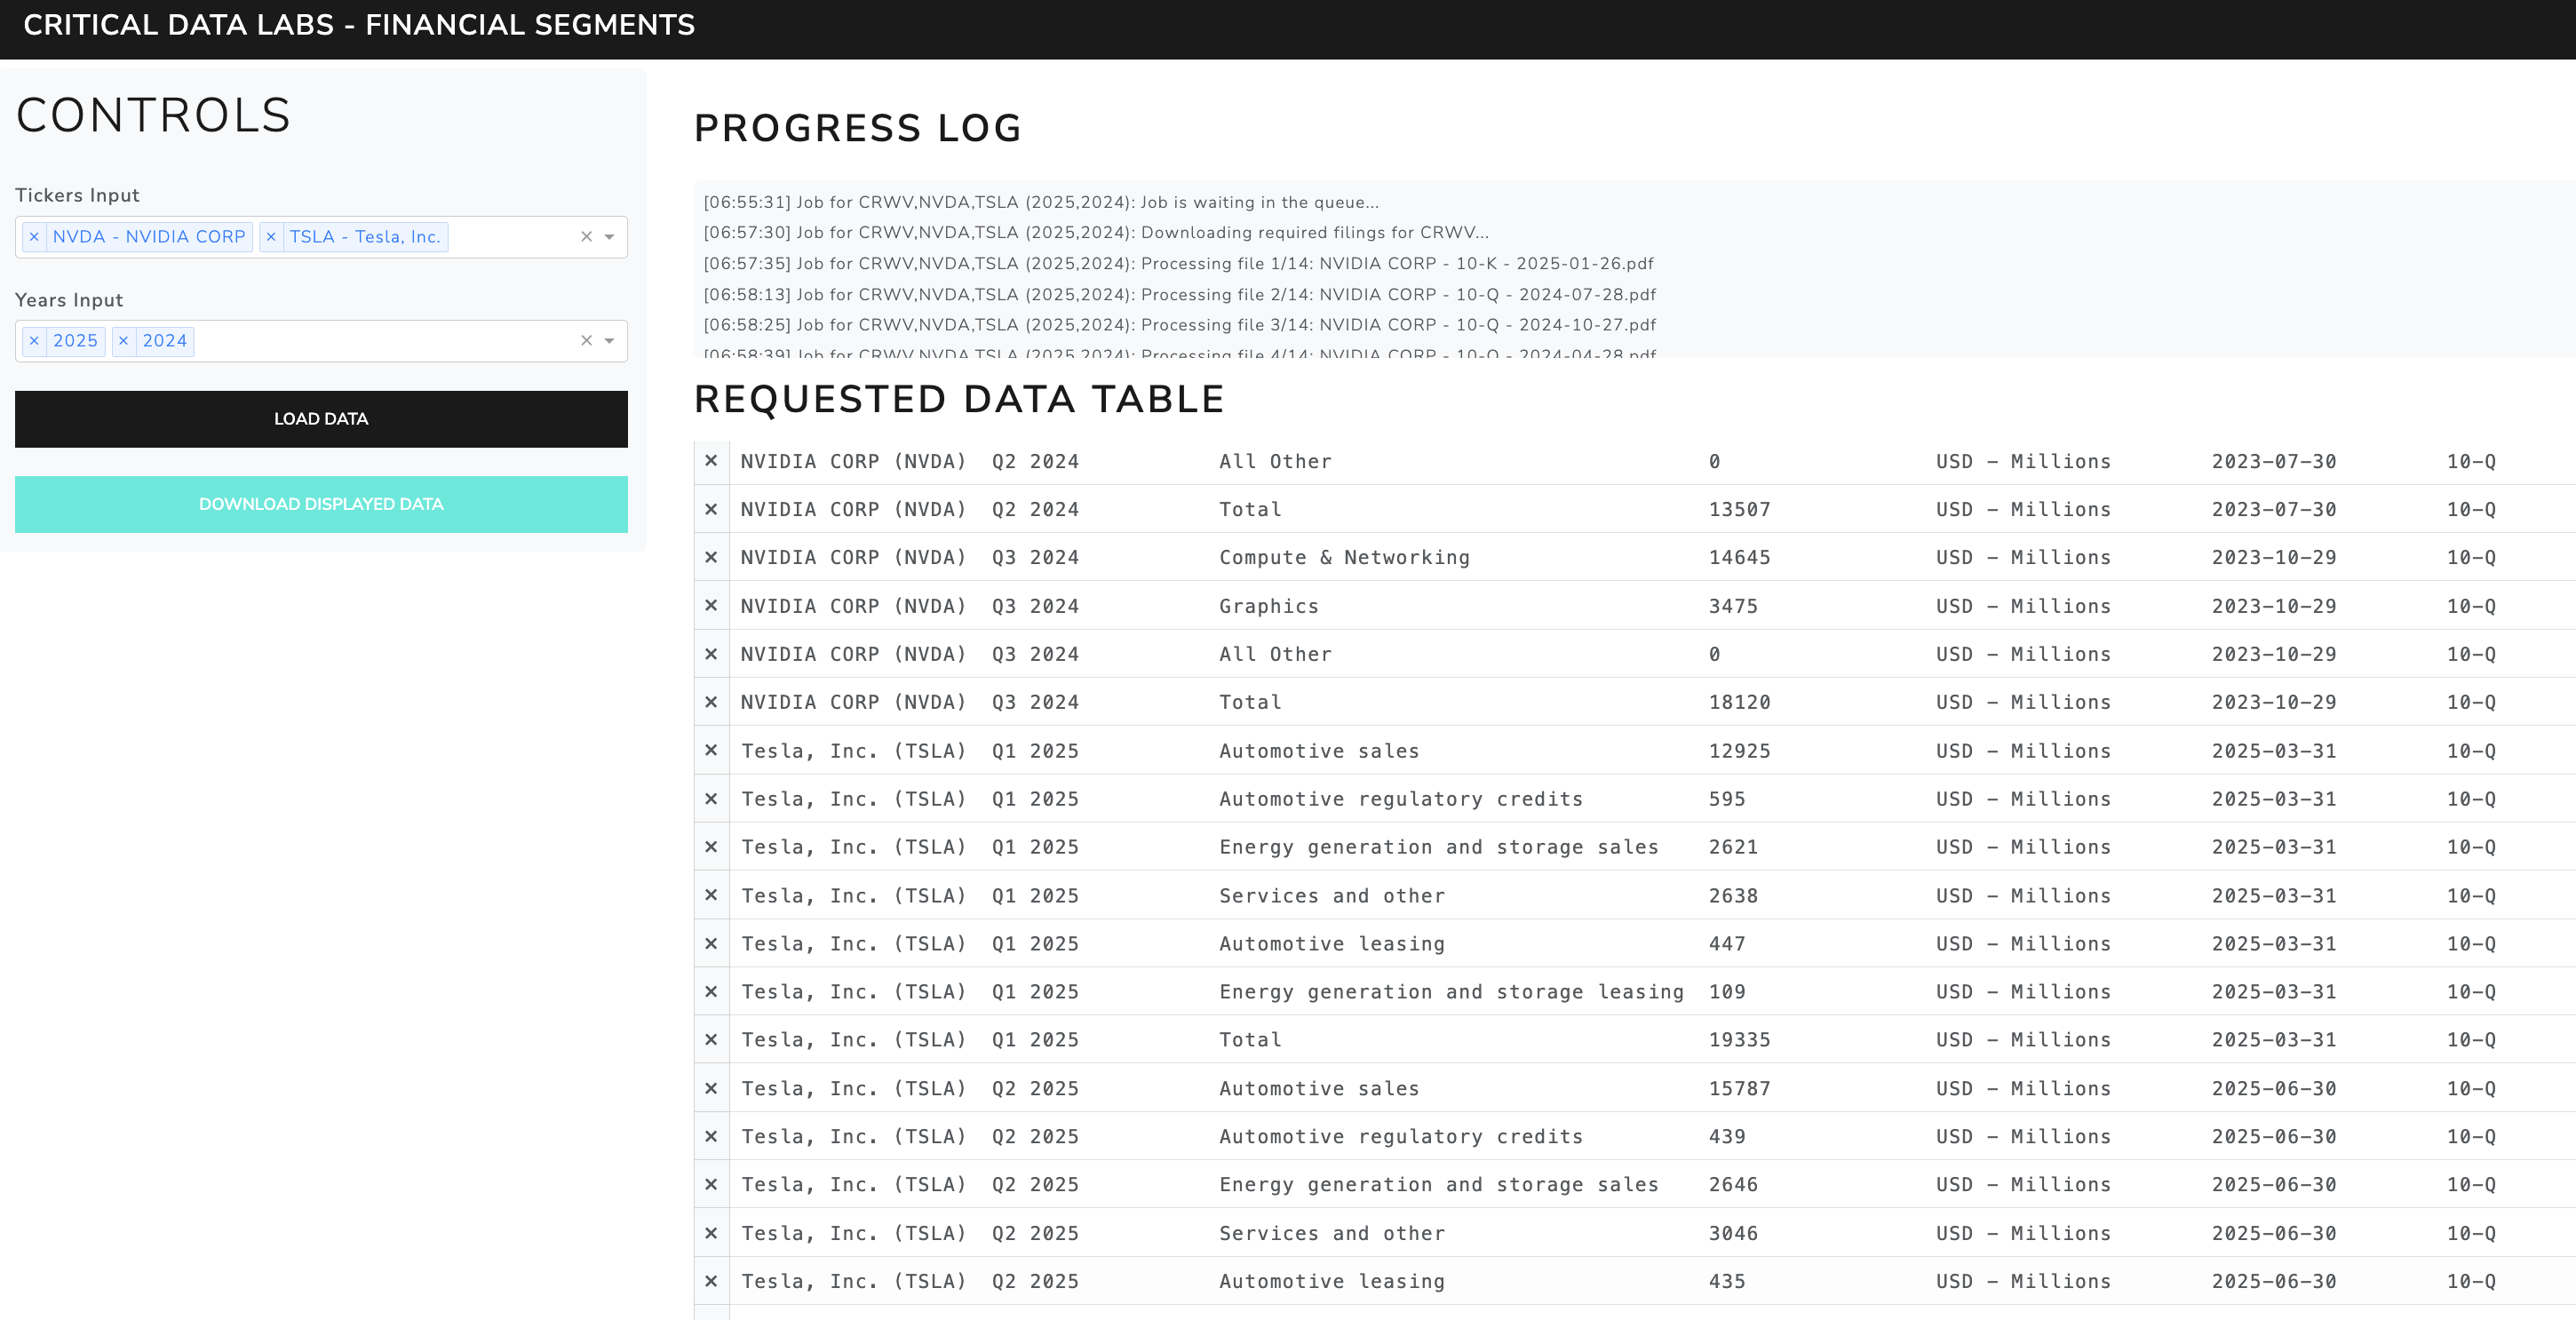
Critical Data Labs
Segment level revenue data
6
Problem
Users need to manually dig through endless 10-K filings or pay for expensive databases to access business segment revenue data
Solution
A research tool enabling quick access to SEC-derived segment revenue data with a database of +10k tickers
Customers
Investment analysts, financial researchers, and corporate strategists requiring accurate revenue segmentation for valuation, benchmarking, or market analysis
Unique Features
Direct integration of official SEC filings, automated extraction of segment-level data, and instant access without manual parsing
User Comments
Saves hours of manual research
Cost-effective alternative to Bloomberg Terminal
User-friendly interface for financial data
Reliable SEC-sourced information
Covers diverse industries
Traction
Already integrated +10k tickers in database (claimed in description)
No explicit MRR/user metrics provided in given data
Market Size
The global $42.7 billion business intelligence market (Statista 2023) aligns with this product's focus

Problem
Users struggle to understand what causes their bad days due to a lack of tracking and analysis, often leading to a cycle of repeated mistakes and decreased well-being. The drawbacks include lack of tracking and analysis of bad days.
Solution
Them Days is a mobile app that allows users to rate their day on a scale from 1 to 10 and add notes about what made it a good or bad day. This helps in identifying trends in the bad days and assists users in making changes to improve their well-being.
Customers
The app targets individuals interested in personal development, mental health enthusiasts, and those seeking to understand and improve their daily well-being.
Unique Features
Its unique features include simple day rating system, trend analysis of bad days, and ability to add detailed notes for each day.
User Comments
Users appreciate the intuitive design.
Helpful in tracking mood and identifying patterns.
Some users request more in-depth analytics features.
Positive impact on their mental health and awareness.
Ease of use highlighted as a major benefit.
Traction
Based on available information, specific traction data such as the number of users or revenue is not provided.
Market Size
The global mental health app market size was $4.2 billion in 2021 and is expected to grow.

Data Grid Master
Apply spreadsheets to data grids in seconds
5
Problem
Users manually fill Figma data grids with mock data, which is time-consuming and error-prone.
Solution
A Figma plugin that instantly imports spreadsheet data (Excel/Google Sheets/CSV) into data grids, automatically mapping to component properties and text nodes.
Customers
UI/UX designers and frontend developers working with data-heavy applications in Figma
Alternatives
View all Data Grid Master alternatives →
Unique Features
Works with AG Grid/MUI-X libraries, supports real-world spreadsheet formats natively, maintains Figma component property relationships
User Comments
Saves hours of manual data entry
Essential for realistic prototypes
Works seamlessly with Excel exports
Perfect for complex grid testing
Immediate time-to-value
Traction
Launched 2023-09-15
500+ Figma installs
Featured in 17 design system workflows
4.8/5 PH rating (87 votes)
Market Size
Figma's 4M+ active designers creating data-intensive interfaces (2023 Figma Config Report)