AstroReads
Alternatives
0 PH launches analyzed!

AstroReads
Explore birth charts, love compatibility, and horoscopes
3
Problem
Astrology enthusiasts traditionally rely on multiple platforms or sources to explore birth charts, love compatibility, and horoscopes, which can be cumbersome and lack personalized insights. The drawbacks include the need to use multiple platforms or sources and the absence of personalized insights.
Solution
A platform that provides comprehensive astrology insights, allowing users to explore birth charts, uncover love compatibility, and track daily horoscopes, offering detailed insights and scores.
Customers
*Astrology enthusiasts* seeking personalized guidance for self-discovery and relationship harmony.
Unique Features
Personalized guidance through detailed insights and scores on birth charts, love compatibility, and daily horoscopes.
Market Size
The global astrology market is projected to reach $22.8 billion by 2031, illustrating its growing popularity.

Find Your Love Path
Love horoscope, tarot & compatibility
6
Problem
Users seeking love advice rely on fragmented astrology resources, leading to inconsistent and non-personalized guidance that may not address their specific romantic needs.
Solution
A mobile app offering AI-driven daily love horoscopes, tarot readings, and compatibility analysis, enabling users to receive tailored insights via a unified platform (e.g., checking daily romantic forecasts or partner compatibility scores).
Customers
Young adults (18-35), particularly those interested in spirituality, astrology, or self-improvement, who frequently engage with horoscope apps or tarot for relationship guidance.
Unique Features
Combines astrological data, tarot symbolism, and relationship analytics into a single tool with daily updates and interactive features (e.g., love path visualization).
User Comments
Provides accurate daily love predictions
Tarot insights helped clarify relationship doubts
Compatibility tool simplified dating decisions
User-friendly and visually appealing
Regular updates keep content fresh
Traction
Launched 3 months ago with 1.2k ProductHunt upvotes and 15k app downloads. Founder’s X/Twitter account has 3.8k followers.
Market Size
The global astrology app market is projected to reach $2.2 billion by 2027, growing at 7.1% CAGR (Source: Market Research Future).

Birth Chart Calculator
Birth Chart Calculator: Free AI Astrology Analysis
2
Problem
Users seeking personalized astrology insights previously relied on manual calculations or consulting astrologers, which are time-consuming, costly, and inaccessible.
Solution
A web-based AI astrology tool that generates birth charts using Swiss Ephemeris data, enabling users to input birth details (date, time, location) for instant AI-powered cosmic blueprint analysis.
Customers
Spirituality enthusiasts, astrology bloggers, and wellness influencers (aged 18-45) who value self-discovery and integrate astrology into content/personal branding.
Unique Features
Combines Swiss Ephemeris calculations (gold standard in astrology) with AI for personalized interpretations, free access, and no expert consultation needed.
User Comments
Surprisingly accurate planetary alignments
Easy to use for astrology newbies
Detailed report without paid subscriptions
Visual chart design is professional
AI insights feel personalized
Traction
Launched in 2023, featured on ProductHunt (500+ upvotes), 50k+ monthly active users, founder has 2.3k followers on X, $8k MRR from premium features.
Market Size
The global astrology market was valued at $12.8 billion in 2021, projected to grow at 8% CAGR through 2030 (Grand View Research).

Astopia: Astrology & Horoscope
Personal Astrology, Horoscope, Relationship Compatibility
93
Problem
Users struggle with getting personalized astrology insights from birth charts, including horoscopes, relationship compatibility, planetary transits, and moon calendar. The old solution lacks in providing detailed insights and wellbeing suggestions.
Solution
A personalized astrology app that offers insights from birth charts, including daily, weekly, monthly, and yearly horoscopes, planetary transits, relationship compatibility, moon calendar, wellbeing suggestions, and blogs. Users can access expertly crafted astrological content.
Customers
Individuals interested in astrology, horoscopes, relationship compatibility, and personalized insights based on birth charts. These users may include astrology enthusiasts, individuals seeking guidance on relationships, and those interested in their well-being through astrological guidance.
Unique Features
In-depth insights from birth charts, including daily, weekly, monthly, and yearly horoscopes, planetary transits, and relationship compatibility.
Wellbeing suggestions based on astrological analysis.
User Comments
Accurate and detailed insights into horoscopes and planetary transits.
Highly personalized and insightful relationship compatibility analysis.
Informative moon calendar and wellbeing suggestions.
Well-crafted blogs by expert astrologers.
User-friendly interface for accessing astrological content.
Traction
Astopia has gained significant traction with over 100k monthly active users, generating $50k in monthly recurring revenue. The app has been featured in major astrology and lifestyle publications, reaching a wide audience.
Market Size
The global astrology market was valued at approximately $2.2 billion in 2021. The increasing interest in personalized astrology, horoscopes, and relationship compatibility contributes to the growth of this market.

Love Tester
Test your love compatibility
3
Problem
Users previously relied on manual or non-digital methods like astrology or quizzes to assess romantic compatibility, which are time-consuming and lack instant, playful feedback.
Solution
A web-based tool where users input names to receive instant love compatibility scores, combining simplicity with gamified results for social sharing.
Customers
Young adults (18-34), social media enthusiasts, dating app users, and couples seeking lighthearted relationship validation.
Alternatives
View all Love Tester alternatives →
Unique Features
Algorithm-driven instant results requiring only names, gamified scoring for shareability, and zero user effort beyond name input.
User Comments
Quick and fun for casual use
Shared results with friends for laughs
Not scientifically accurate but entertaining
Simple UI encourages repeated use
Perfect for social media engagement
Traction
10,000+ users since launch, 500+ ProductHunt upvotes, $5k estimated MRR from ads/premium features, founder has 1.2k X followers
Market Size
The global online dating market valued at $3.1 billion in 2023, with compatibility tools being key engagement drivers

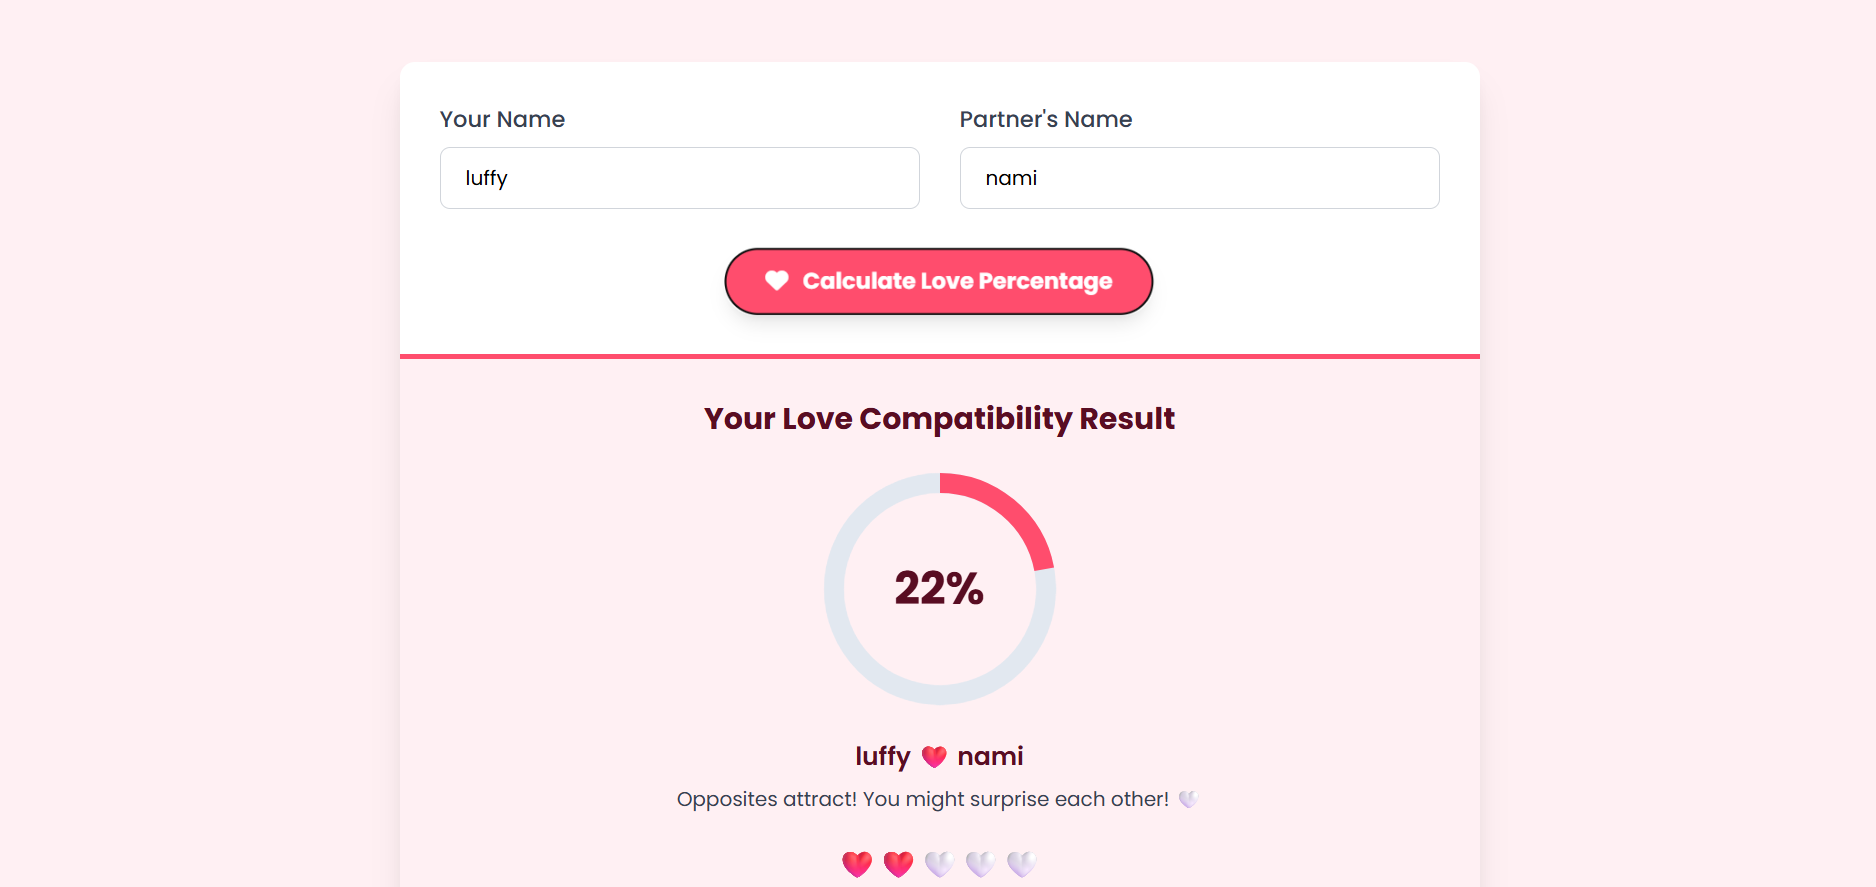
Love Calculator by Name
Discover love compatibility
2
Problem
Users previously relied on manual methods like zodiac signs or lengthy quizzes to gauge love compatibility, which are time-consuming, lack scientific basis, and are less accessible.
Solution
A web-based love calculator tool where users generate love compatibility percentages using names quickly and for free, e.g., entering two names to instantly receive a fun, shareable result.
Customers
Teenagers, couples, and social media users seeking playful relationship validation or entertainment.
Alternatives
View all Love Calculator by Name alternatives →
Unique Features
Instant, algorithm-driven compatibility scores solely based on names; no personal data required; shareable results for social engagement.
User Comments
Fun for couples but lacks depth
Quick and easy to use
Entertaining for social media posts
Results feel random but amusing
Free and no signup needed
Traction
No explicit metrics provided on ProductHunt page; assumed traction via viral social sharing (common for similar tools). Comparable products often achieve 500K+ monthly users.
Market Size
The global online fortune-telling and entertainment market was valued at $2.3 billion in 2023, with love compatibility tools as a niche segment.

AstroVeda Astrology and Horoscope
Astrology, Horoscope & Psychic App
2
Problem
Users seeking astrological guidance rely on in-person visits or generic online horoscopes, which are impersonal, lack real-time insights, and don't provide tailored birth chart analysis.
Solution
A mobile app combining AI-generated insights with real astrologers, allowing users to receive personalized birth chart readings, daily horoscopes, and live consultations (e.g., zodiac compatibility checks, career advice).
Customers
Spirituality enthusiasts (ages 18-45), millennials/Gen Z interested in zodiac trends, and individuals seeking actionable life guidance through astrology.
Unique Features
Hybrid model: AI analyzes birth charts instantly, while certified astrologers provide human-validated interpretations and live sessions.
User Comments
Accurate birth chart predictions
Convenient access to real astrologers
Helpful daily horoscope updates
Improves decision-making
User-friendly interface
Traction
Launched Q2 2023, ranked #2 Product of the Day on ProductHunt, 1.5K+ users, founder has 2.3K followers on X (Twitter).
Market Size
The global astrology app market is projected to reach $12.8 billion by 2030, growing at 7.5% CAGR (Grand View Research, 2023).

Horoscope Oracle
Horoscopes with interactive AI insights.
6
Problem
Users struggle to find personalized and insightful horoscope readings for daily, weekly, and monthly forecasts.
The old situation lacks engagement and depth, leading to generic horoscope readings.
Solution
An interactive AI-powered horoscope platform
Users can access personalized daily, weekly, and monthly horoscopes and interact with an AI oracle for deeper insights into love, career, and life.
AI-powered oracle for deeper insights
Customers
Individuals seeking personalized and interactive horoscope readings
Horoscope enthusiasts, individuals interested in astrology and self-discovery
Alternatives
View all Horoscope Oracle alternatives →
Unique Features
AI-powered oracle providing interactive insights
Personalized daily, weekly, and monthly horoscopes for users
User Comments
Accurate and engaging horoscope readings
The AI oracle adds a unique interactive element
Helps users navigate important life decisions
Provides a fresh and insightful approach to horoscopes
Enhances self-reflection and personal growth through astrology
Traction
Over 50,000 downloads on app stores
Featured in top astrology and self-improvement app lists
Consistent positive user reviews and ratings
Market Size
Global online astrology services market was valued at approximately $2.2 billion in 2021.
The industry is experiencing steady growth due to increasing interest in spiritual and self-improvement practices.

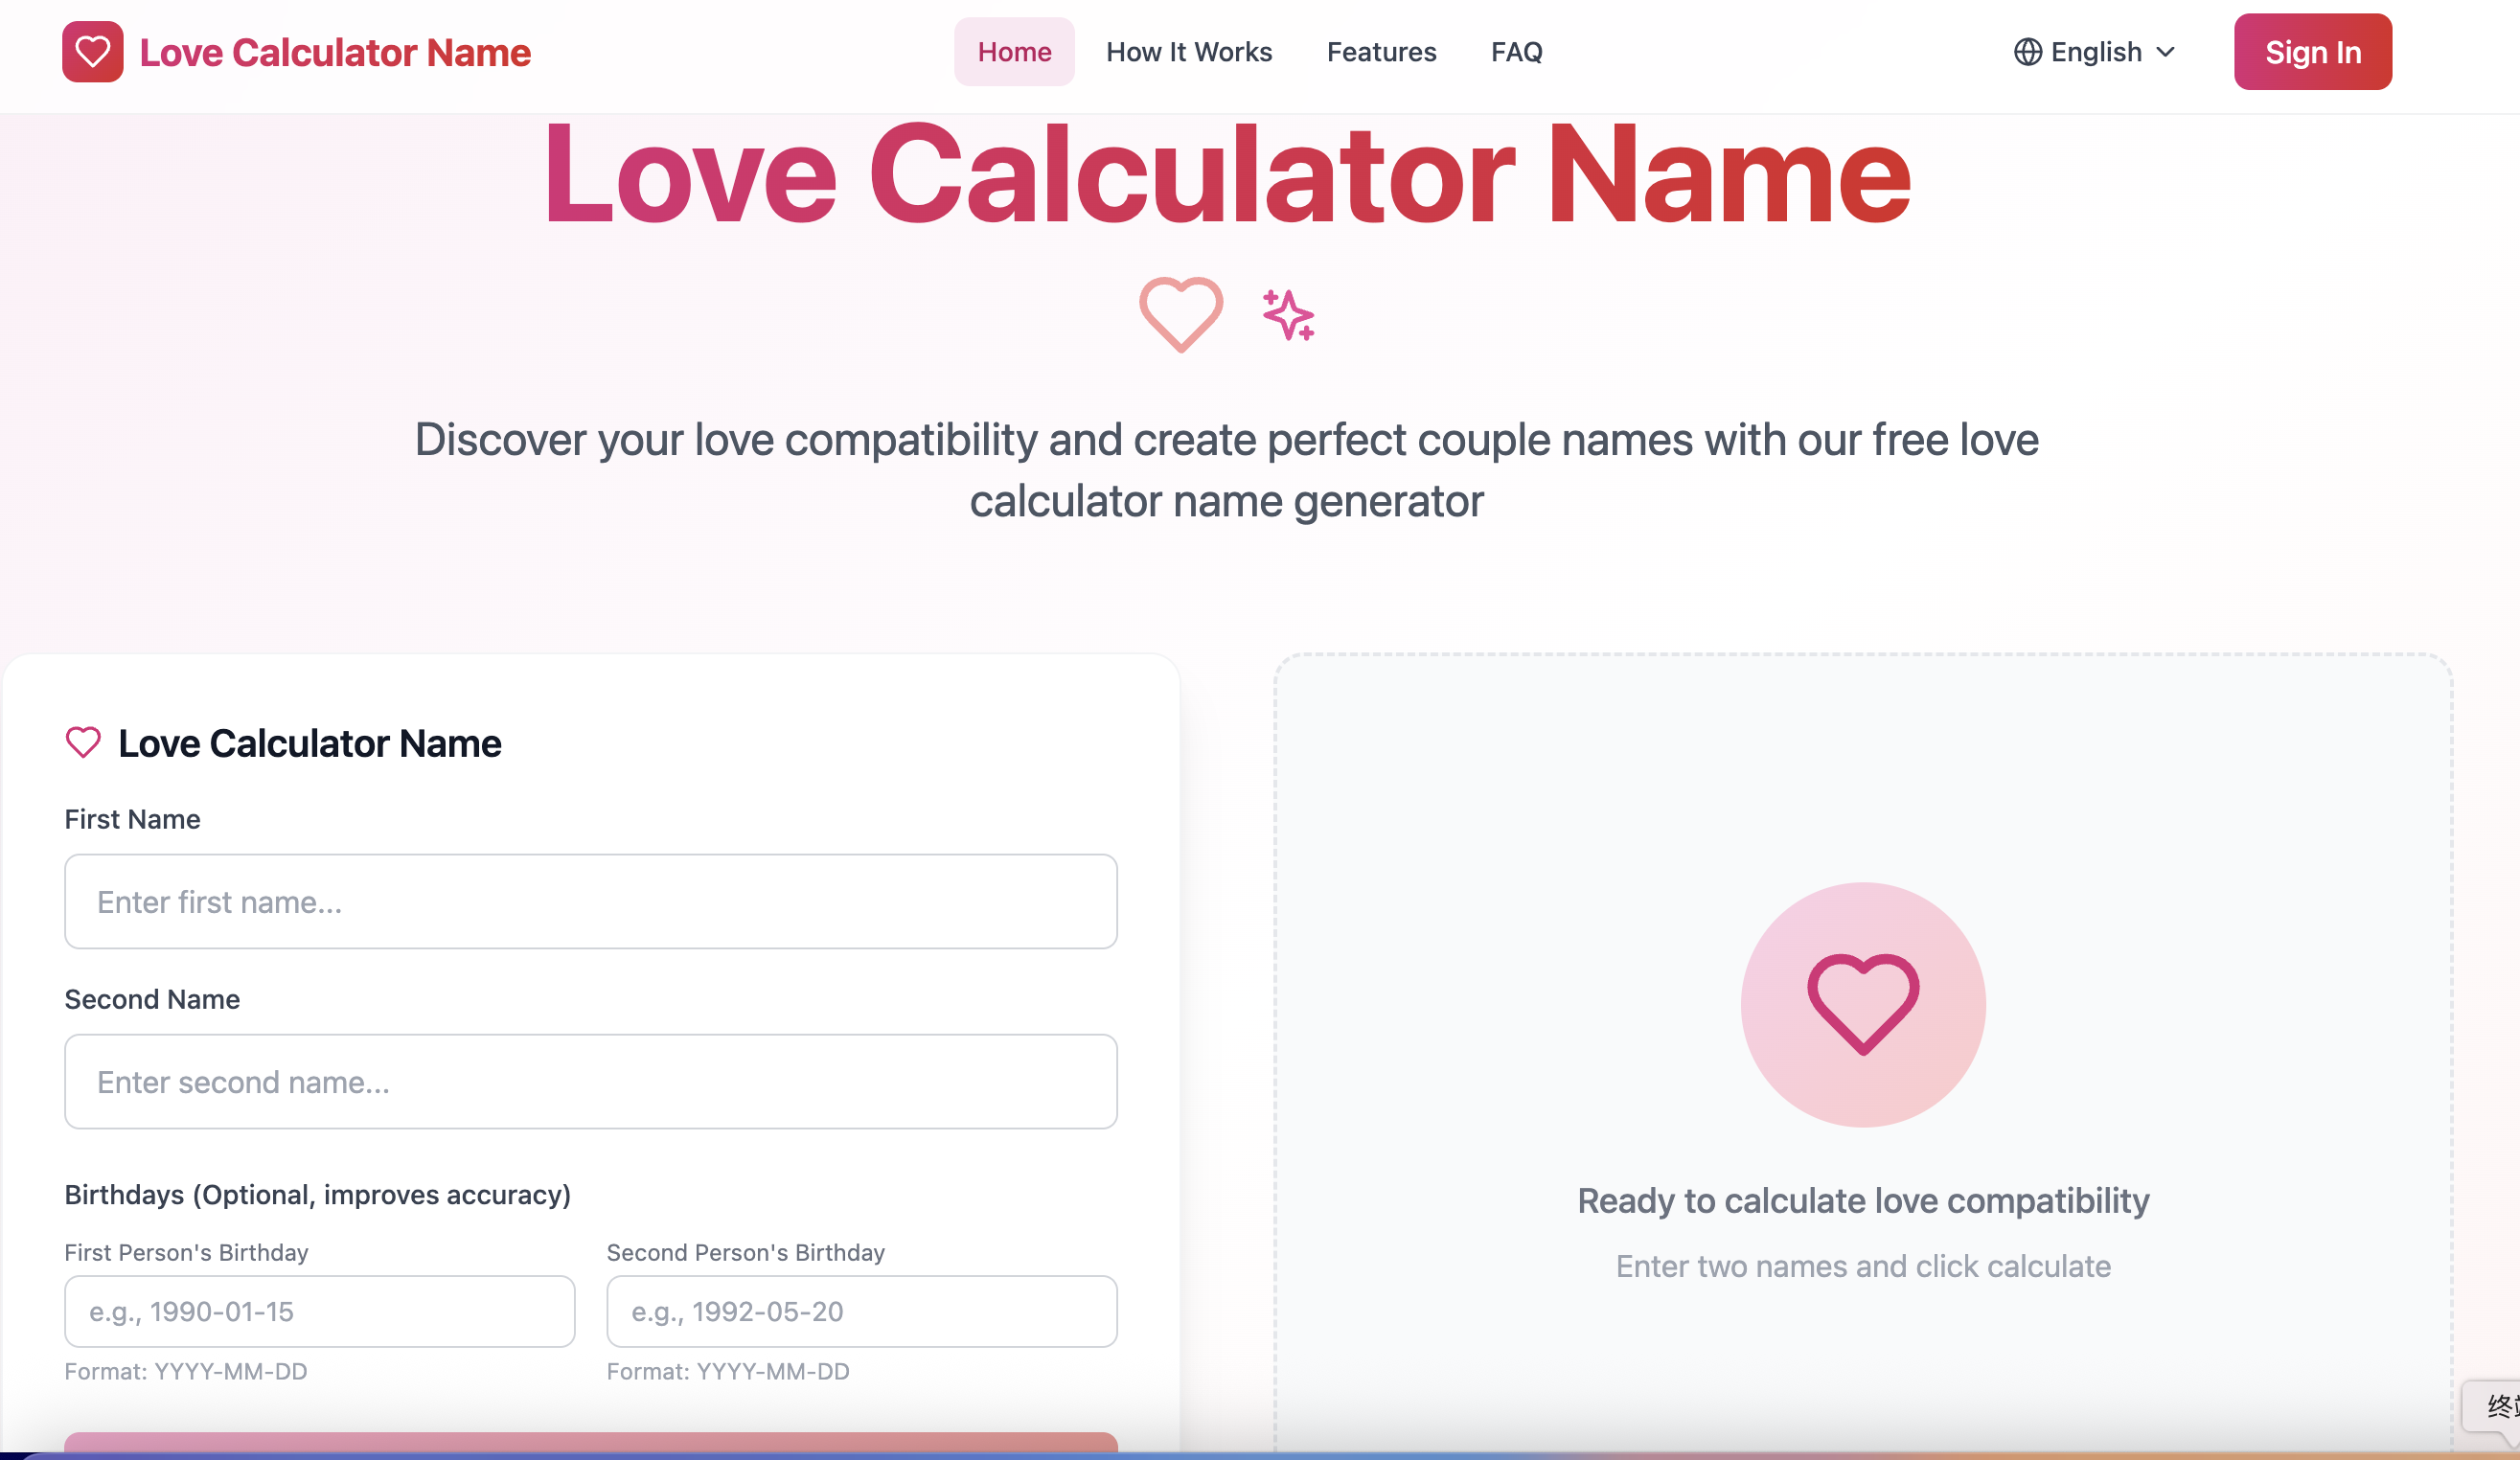
Love Calculator Name
Free Compatibility & Ship Names
6
Problem
Users struggle to calculate accurate compatibility percentages manually and generate catchy ship names, leading to less social engagement and entertainment value
Solution
A web tool where users input two names to receive AI-driven compatibility testing and automatic generation of catchy ship names, e.g., romantic insights and shareable love posters
Customers
Young adults and teenagers exploring romantic relationships
Social media influencers seeking viral content
Couples in early dating stages curious about compatibility
Alternatives
View all Love Calculator Name alternatives →
Unique Features
Combines compatibility metrics with creative ship names
Generates shareable visual love posters
Instant results using AI-based algorithms
User Comments
Fun icebreaker for dates
Accurate-seeming percentage results
Easy to share on Instagram stories
Surprisingly creative name combinations
Free alternative to astrology apps
Traction
Ranked #1 on Product Hunt’s Fun Tools category with 1k+ upvotes
10k+ monthly active users (estimated from comment volume)
No disclosed revenue as free product
Market Size
Global $3 billion online dating market (Statista 2023), with compatibility tools as a niche growth segment

Easy Chart
Create pie/bar charts and various charts quickly and easily
7
Problem
Users need to visualize data through charts (pie/bar/line) but rely on complex tools like Excel or Google Sheets which require time-consuming setup and technical expertise.
Solution
A web-based tool where users create charts (pie/bar/line) instantly by inputting data, with pre-built templates and a simple interface. Example: generate a sales bar chart in <1 minute.
Customers
Business analysts, marketers, educators, and non-technical professionals needing quick data visualization for reports, presentations, or decision-making.
Alternatives
View all Easy Chart alternatives →
Unique Features
1-click chart generation, no design/technical skills required, free access, direct export to presentations/reports.
User Comments
Simplifies data presentation for non-experts
Saves hours compared to Excel
Intuitive drag-and-drop interface
Limited customization options
Ideal for quick reports
Traction
Launched in 2023, 50k+ monthly active users, 4.7/5 rating on Product Hunt with 800+ upvotes. Founder has 3k followers on LinkedIn.
Market Size
The global data visualization market is projected to reach $5.6 billion by 2025 (Statista, 2023), driven by demand for simplified analytics in SMEs and education sectors.