What is NPM Chart?
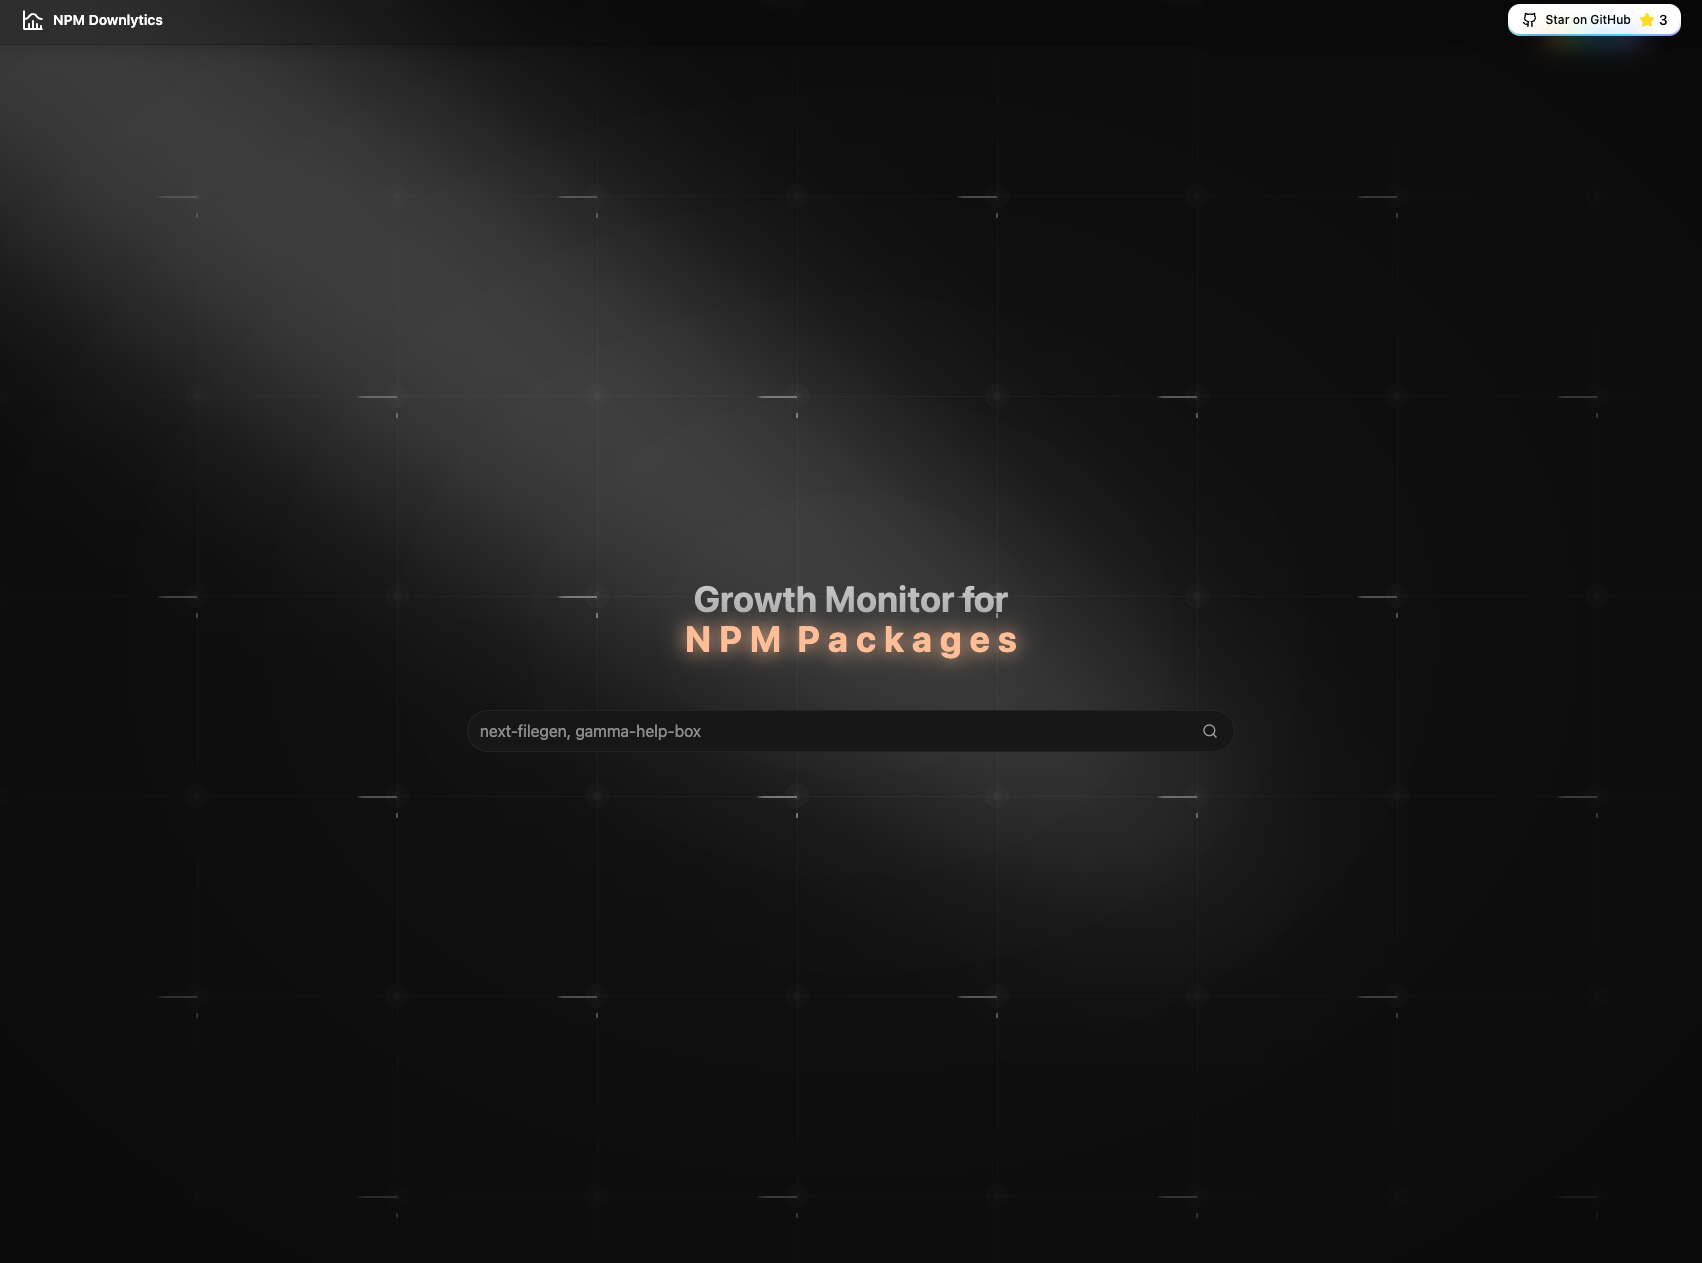
Visualize npm downloads in a beautiful chart, ready to be shared with your community.
Problem
Users have difficulty visualizing npm package download stats over time
Users are unable to share npm download stats with their community easily
Existing solutions lack visually appealing charts for npm download stats
Solution
A web tool that generates beautiful charts to visualize npm download stats
Users can easily share the generated charts with their community
Core features include visualizing npm package download stats in a chart format
Customers
Web developers
Open-source project maintainers
Tech communities
Users who need to analyze and share npm package download stats
Unique Features
Simple visualization of download stats
Easy sharing options for the generated charts
Focus on providing aesthetically pleasing charts for npm download stats
User Comments
Easy to use and great for sharing download stats
Helps in understanding download trends easily
Useful tool for the npm community
Saves time compared to manual data analysis
Clean and clear charts
Traction
$10k MRR with 5,000 users
Positive feedback from early adopters
Featured on major tech platforms
Continuous growth in user base
Active community engagement
Market Size
The global market for developer tools and analytics was valued at $16.87 billion in 2020
Increased adoption of npm packages and need for analytics tools in the developer community
Growing trend towards data-driven decision-making in software development


