What is Givance?
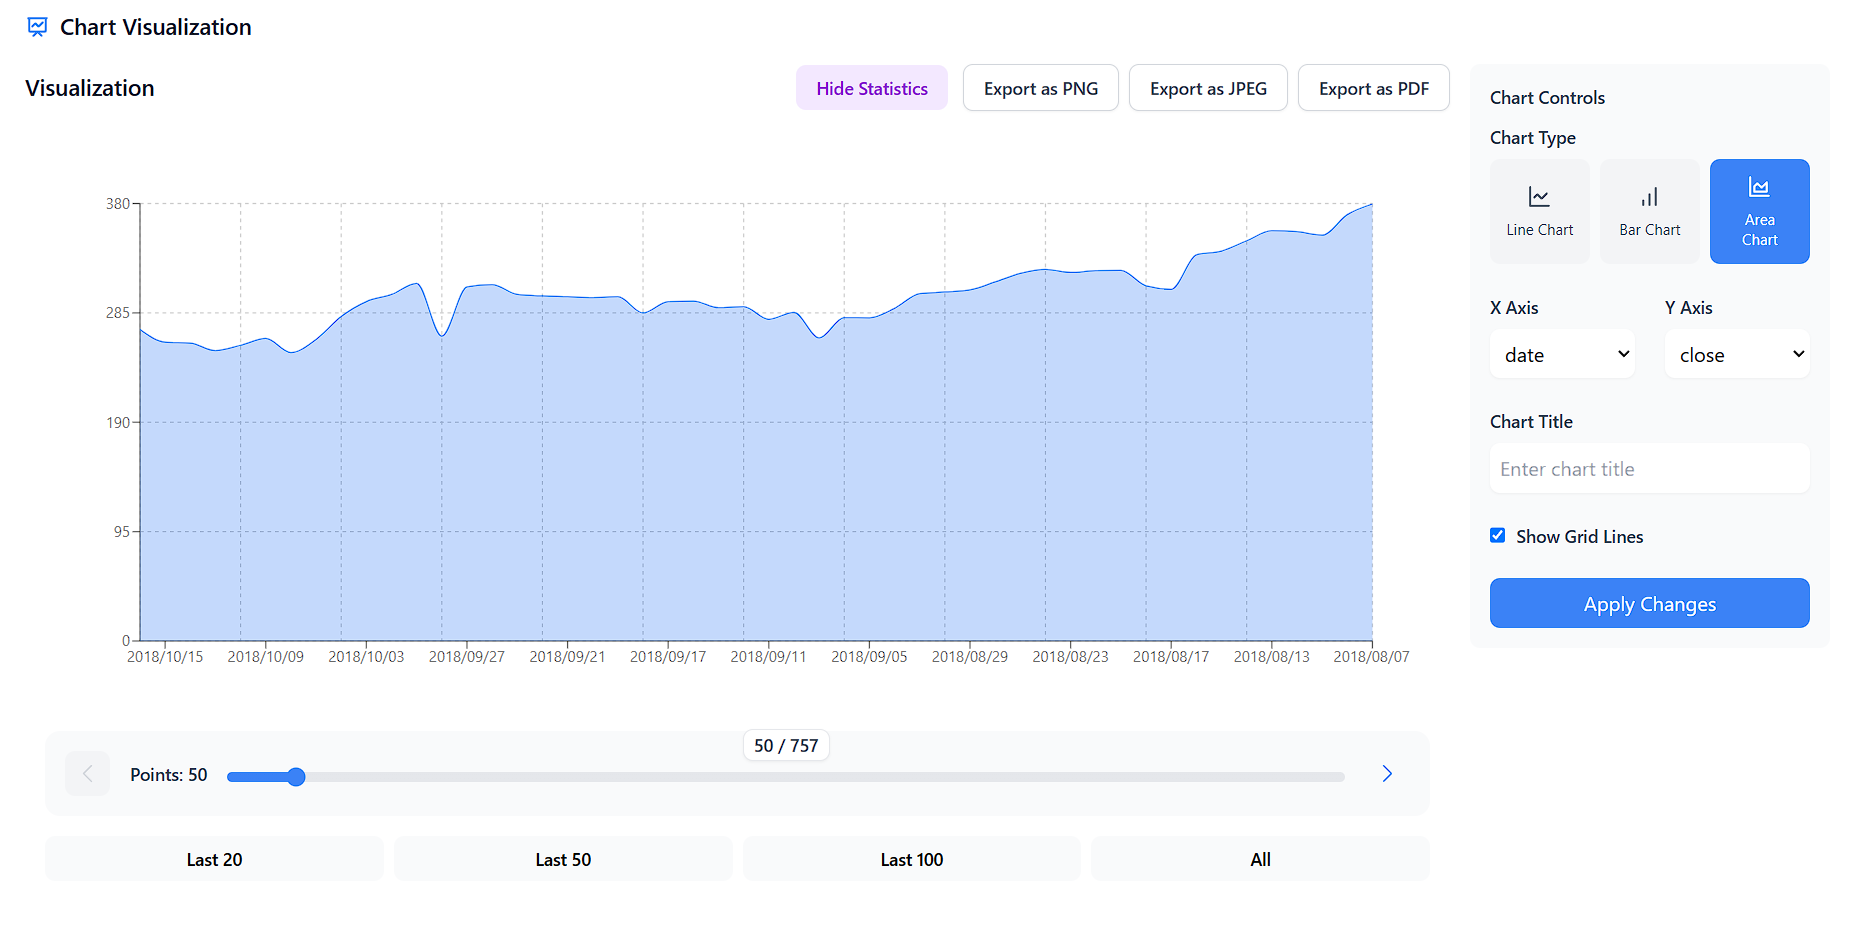
Givance turns raw data or plain text into editorial grade charts and interactive visuals in seconds. Paste a dataset or write a prompt, remix with simple edits, and create professional visuals without design or coding overhead.
Problem
Users struggle to create professional, editorial-grade data visuals manually or with traditional tools like Excel, which are time-consuming and require design expertise, leading to subpar visual outputs.
Solution
A web-based AI tool that lets users transform raw data or text into editorial-grade charts and interactive visuals through prompts, simple edits, and preset templates without coding or design skills.
Customers
Data analysts, journalists, marketers, and researchers who need to present complex data in visually compelling formats for reports, articles, or presentations.
Unique Features
Automated conversion of raw data/plain text into polished visuals, customizable templates, interactive elements, and export-ready formats for seamless integration into editorial workflows.
User Comments
Simplifies chart creation for non-designers
Saves hours of manual work
Elevates data storytelling quality
Intuitive UI with minimal learning curve
Lacks advanced customization for niche use cases
Traction
Launched on Product Hunt in 2024 with 180+ upvotes; actively iterating based on user feedback (exact revenue/user metrics not publicly disclosed).
Market Size
The global data visualization tools market was valued at $9.01 billion in 2022, projected to grow at 10.2% CAGR through 2030 (Grand View Research).


