What is Dataflow?
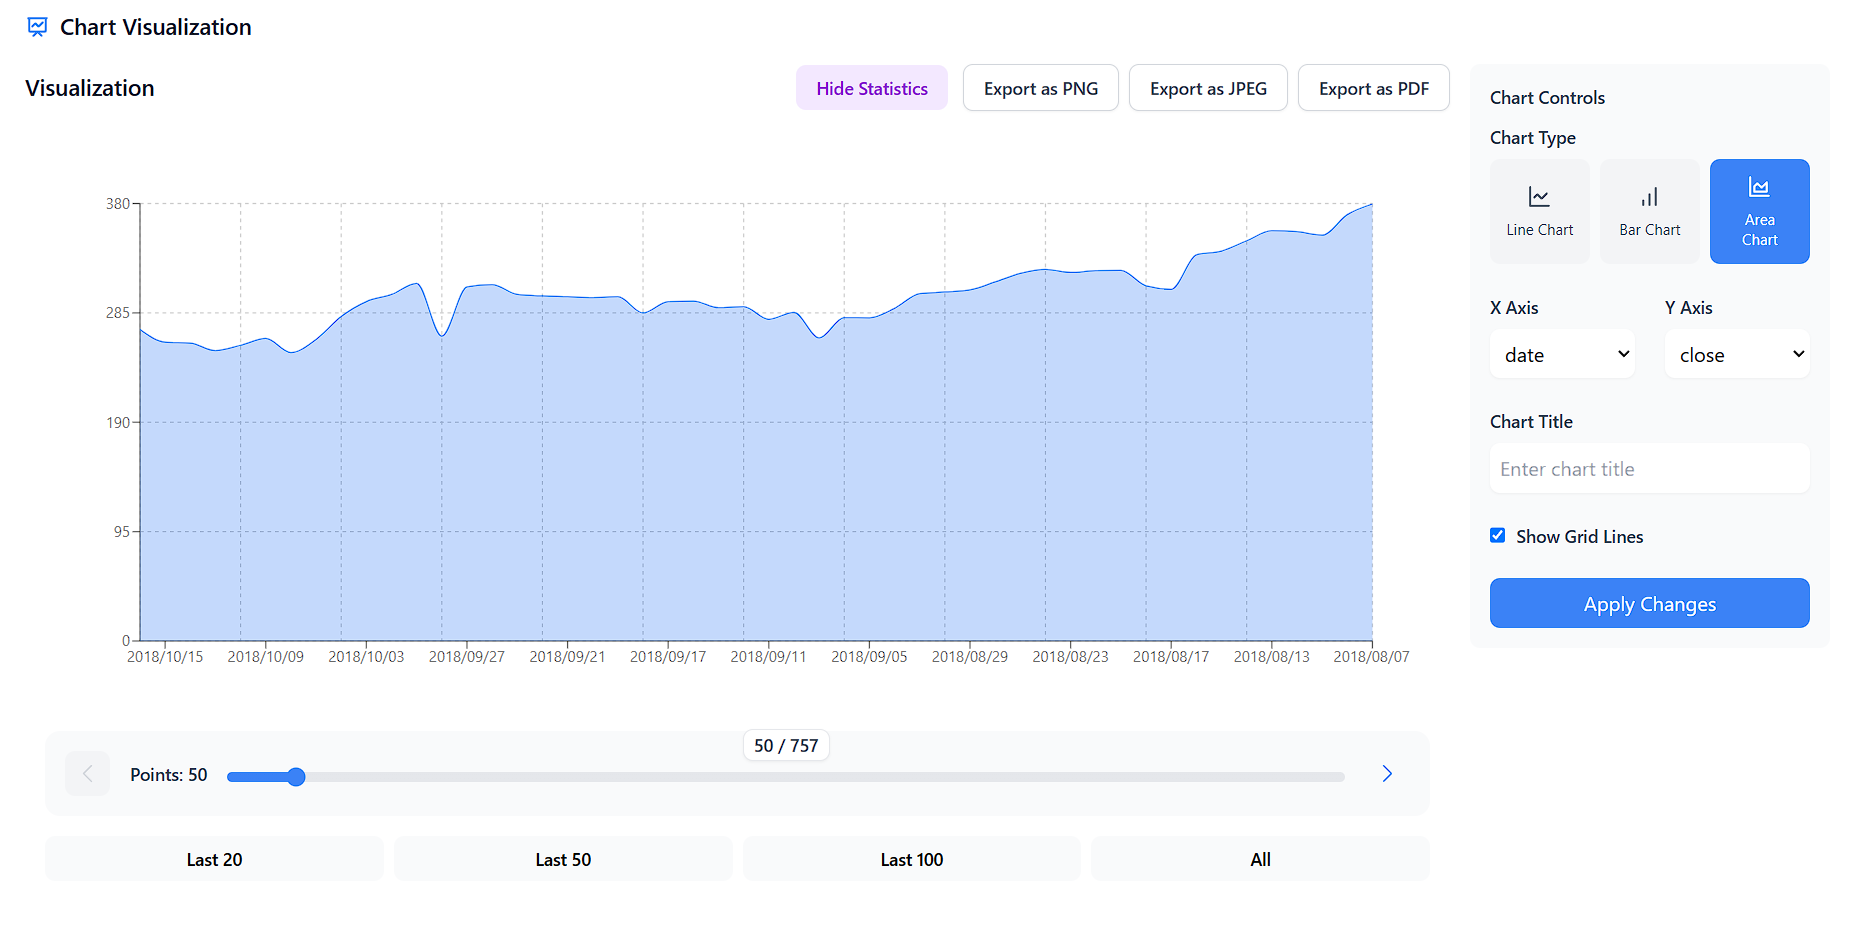
As a QA Engineer, I built DataFlows to simplify data analysis. Quickly filter rows/columns, visualize data with charts & pivot tables, and customize reports. It’s a browser-based tool that makes working with raw data easier. Try it at DataFlows!
Problem
Users, especially QA engineers, struggle with data analysis using complex tools, leading to time-consuming processes and difficulty in generating meaningful reports.
Solution
A browser-based tool (DataFlows) that simplifies data analysis for QA engineers by allowing quick filtering of rows/columns, visualization of data with charts & pivot tables, and customization of reports.
Customers
QA Engineers and professionals who need to work with raw data for analysis, reporting, and visualization.
Unique Features
Quick filtering of rows/columns, data visualization with charts & pivot tables, and report customization to streamline the data analysis process.
User Comments
Intuitive tool for data analysis
Saved me a lot of time in generating reports
Great visualization options
Simple and easy-to-use interface
Perfect for QA professionals
Traction
DataFlows has 1.2k upvotes on ProductHunt
The tool gained 500 users within the first month of launch
Generating $10k MRR with an increasing user base
Market Size
The global data visualization market size was valued at $4.51 billion in 2020 and is expected to reach $7.76 billion by 2025, with a CAGR of 11.5%.


