Wishful Gitting
Alternatives
0 PH launches analyzed!

Wishful Gitting
Github glow-up! Hack your contribution graph!
45
Problem
GitHub users often face inconsistencies in their contribution graphs due to periods of inactivity, which can negatively impact their reputation and the appearance of their profiles to potential employers or collaborators.
Solution
Wishful Gitting is an online tool that allows users to manipulate their GitHub contribution graph, either by realistically filling in gaps in their activity or embedding custom text messages. Users can thereby improve their profile's appearance.
Customers
Developers, software engineers, and job seekers in the tech industry looking to enhance their GitHub profiles.
Alternatives
Unique Features
The ability to customize the GitHub contribution graph with text messages or fill in inactivity gaps is a standout feature, offering a unique way for users to personalize or enhance their GitHub profiles.
User Comments
Users appreciate the creative aspect of the tool.
It's mentioned as a fun way to customize GitHub profiles.
Some users express concerns about the ethical implications.
There's curiosity about how the manipulation is achieved.
Feedback includes suggestions for additional customization options.
Traction
Specific traction data, such as number of users, revenue, or significant growth metrics, is not mentioned, highlighting a potential area for further research or direct inquiry.
Market Size
The global DevOps market size, relevant as a context for GitHub and tools like Wishful Gitting, was valued at $6.78 billion in 2021 and is expected to grow, showing a significant market potential for development and collaboration tools.

GitHub Graph Drawer
Type some text on your GitHub contributions graph.
64
Problem
GitHub users struggle to personalize their contributions graph. This can lead to a less engaging profile that fails to stand out, lacking a personal touch or creative personalization.
Solution
A tool that allows users to type text on their GitHub contributions graph. By entering the desired text, users can create a personalized contributions graph that showcases their creativity or personal messages directly on their GitHub profile. The core feature is its ability to personalize the GitHub contributions graph with text.
Customers
The primary users are GitHub users, including developers, programmers, and tech enthusiasts who are active on GitHub and are looking to personalize their profiles.
Alternatives
View all GitHub Graph Drawer alternatives →
Unique Features
The unique aspect of this product is its capability to allow direct text input on a user's GitHub contributions graph, making it simple to customize and add a personal or branded message uniquely.
User Comments
As the specific user comments are not provided, I'm unable to summarize the user feedback.
Traction
Given the data limitations, specific quantitative traction details about the GitHub Graph Drawer are not available.
Market Size
The market size for GitHub customization tools is not easily quantifiable, but GitHub has over 83 million developers as of 2023, indicating a significant potential user base.

GitHub Contributions on Stream Deck
Stream Deck plugin displays your GitHub contributions graph.
51
Problem
Users need a convenient way to monitor their GitHub contributions graph in real-time.
Current methods of tracking GitHub contributions are cumbersome and require manual effort, which can be time-consuming and inefficient.
Solution
Stream Deck plugin
Users can display their GitHub contributions graph on Stream Deck in real-time, customize it with their GitHub username and token, support light/dark themes, multiple time frames, and auto-refresh every 30 mins.
Core features include displaying GitHub contributions graph, customization with username and token, support for light/dark themes, multiple time frames, auto-refresh, and easy navigation with 5 buttons.
Customers
GitHub users who want to easily monitor their contributions graph without manual tracking.
Developers, software engineers, project managers, and tech enthusiasts who actively use GitHub for version control, collaboration, and monitoring progress.
Unique Features
Real-time display of GitHub contributions graph on Stream Deck
Customization options including themes, time frames, auto-refresh, and easy navigation.
User Comments
Convenient tool for monitoring GitHub activity
Easy customization and refreshing options
Saves time and effort in tracking GitHub contributions manually
Useful for developers and GitHub users
Great addition for Stream Deck users
Traction
Product launched on ProductHunt with positive reviews and engagement
Growing number of downloads and active users on Stream Deck
Increasing visibility within the GitHub community
Market Size
The global market for developer tools and productivity software was valued at around $19 billion in 2021 and is expected to reach approximately $30 billion by 2026.

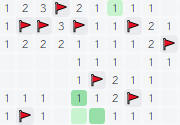
GitHub Contribution Minesweeper
turn your contribution heatmap into a minesweeper board.
6
Problem
Users view their GitHub contribution heatmap as a static, non-interactive element leading to lack of engagement and fun
Solution
Web-based tool that gamifies GitHub contribution heatmaps. Users can convert their heatmap into a Minesweeper game, play it, and share animated SVGs. Examples: solving 'mines' via contribution squares, auto-solving puzzles.
Customers
Developers and GitHub users seeking interactive ways to showcase their coding activity or add novelty to their profiles (age: 20–40, tech-savvy, active on GitHub).
Unique Features
Minesweeper mechanics directly tied to GitHub data, replayable gameplay, auto-solver (algorithmic solving), and exportable animated SVGs.
User Comments
Fun twist on GitHub streaks, addictively creative, enhances developer portfolios, sparks social media shares, nostalgic Minesweeper appeal
Traction
Launched on ProductHunt (500+ upvotes), GitHub Trending mentions, no disclosed MRR or user count. Creator’s X (Twitter): 1.2K followers.
Market Size
GitHub has 100M+ users (2023), with developer tooling market projected to reach $5B+ by 2025.
Problem
Users utilize GitHub contribution graphs to showcase their coding activity, but this often lacks personalization and visual appeal.
Lacks personalization
Lacks visual appeal
Solution
An open source tool
Turn your GitHub contribution graph into a creative canvas
Users can draw with pixels, shapes, or text and customize the intensity of their contributions
Customers
Developers
GitHub users
Tech enthusiasts interested in personalizing their profiles
Unique Features
Real-time preview of changes
Customization of contribution intensity
Use of pixels, shapes, or text to create unique designs
User Comments
Fun and creative way to make GitHub profiles stand out.
Helps in making developer profiles more attractive.
Open-source nature is appreciated by the community.
Easy to use and customize according to preferences.
Some users seek more shapes and color options.
Traction
Product is listed on ProductHunt.
No additional quantitative traction available.
Market Size
The developer tools market is growing rapidly, with the global developer population expected to reach 28.7 million by 2024.
Problem
Users struggle with fragmented code management and collaboration tools, leading to inefficiency in team coordination and project tracking.
Solution
A web-based platform for version control and collaboration enabling developers to host, review, and contribute to code repositories with features like pull requests, issue tracking, and CI/CD integration (e.g., GitHub Actions).
Customers
Developers, software engineers, and tech teams in startups, enterprises, and open-source communities managing codebases.
Unique Features
Largest global repository hosting with 420M+ projects, seamless Git integration, and community-driven collaboration features like forks, stars, and discussions.
User Comments
Simplifies cross-team code collaboration
Essential for CI/CD automation
Central hub for open-source contributions
Robust issue tracking and project management
Integrates with major dev tools natively
Traction
150M+ users, 420M+ repositories, acquired by Microsoft for $7.5B in 2018, annual revenue estimated at $1B+ (2023).
Market Size
The global DevOps market, a core user segment for GitHub, was valued at $10.9 billion in 2023 (Grand View Research).
Problem
Users struggle with inefficient collaboration and code management without integrated version control and project tracking tools, leading to fragmented workflows and slower development cycles.
Solution
A code collaboration and version control platform where users can host, review, and manage code repositories, collaborate via pull requests, and automate workflows (e.g., CI/CD pipelines).
Customers
Developers, open-source contributors, and DevOps engineers working on software projects, ranging from individual coders to enterprise teams.
Unique Features
Git-based version control, issue tracking, Actions for automation, and community-driven open-source collaboration.
User Comments
Essential for modern development workflows; Robust CI/CD integration; Steep learning curve for newcomers; Great for open-source projects; Enterprise features improve team productivity.
Traction
150M+ users, 420M+ repositories, $1B+ annual revenue (2023), and 100M+ active repositories.
Market Size
The global DevOps market, a key segment for GitHub, is valued at $10 billion in 2023 and growing at 20% CAGR.
Problem
Users face inefficient code collaboration and version control with manual sharing methods like email or FTP, leading to disorganized workflows and difficulty tracking changes.
Solution
A web-based version control and collaboration platform using Git, enabling users to host code, manage projects, and collaborate via features like pull requests, issue tracking, and code review. Example: Developers merge branches and resolve conflicts seamlessly.
Customers
Software developers, open-source contributors, DevOps engineers, and tech companies managing codebases.
Unique Features
Integrated Git workflows, community-driven open-source ecosystem, granular access controls, and Actions for CI/CD automation.
User Comments
Streamlines team collaboration
Essential for version control
Integrates well with dev tools
Robust open-source community
Learning curve for Git beginners
Traction
150M+ users, 420M+ repositories, acquired by Microsoft for $7.5B in 2018, $1B+ annual revenue (2023 estimates).
Market Size
Global DevOps market valued at $15.2 billion in 2023, projected to reach $51.8B by 2030 (Grand View Research).
Problem
Users rely on cracked versions of software like Freemake Video Converter, exposing them to legal risks, malware, and lack of updates.
Solution
A version control and collaboration platform (GitHub) enabling developers to build, host, and manage code repositories securely. Examples: Forking projects, pull requests, issue tracking, and CI/CD integration.
Customers
Developers, software engineers, open-source contributors, and tech teams collaborating on codebases and projects.
Unique Features
Comprehensive version control, social coding features (forking, starring), GitHub Actions for automation, and a vast open-source ecosystem.
User Comments
Essential for collaborative coding, Streamlines workflows, Robust community support, Integrates with dev tools, Enhances project visibility.
Traction
150M+ users, 420M+ repositories, owned by Microsoft ($1B acquisition in 2018), $1B+ annual revenue (estimated).
Market Size
The global DevOps market, driven by platforms like GitHub, is projected to reach $25.5 billion by 2028 (Grand View Research).

GitHub Activity Generator
Automate GitHub Contributions
7
Problem
Users may struggle to maintain a consistent and engaging presence on GitHub due to manual and time-consuming commit patterns.
Lack of time and commitment in maintaining regular GitHub contributions.
Solution
A web tool with a 3D space-themed UI that automates realistic commit patterns on GitHub.
Users can customize the frequency of commits and integrate GitHub OAuth for seamless automation.
Customers
Developers and GitHub users looking to automate and maintain a consistent commit history without manual effort.
Developers
Unique Features
Realistic commit patterns automation, 3D space-themed UI, customization of commit frequency, GitHub OAuth integration.
Realistic commit patterns automation and 3D space-themed UI.
User Comments
Users find the tool helpful for automating commit patterns.
Appreciation for the customizable frequency feature.
Positive feedback on the 3D space-themed UI.
Users mention it is great for learning OAuth, Git automation, and API.
Some users suggest improvements for additional customization options.
Traction
The website doesn't provide specific quantitative traction data.
The product seems to have gained popularity among developers and GitHub users based on user comments and reviews.
Market Size
Market size for developer productivity tools has been growing steadily, with the industry valued at approximately $18 billion in 2021.


