Pricing Table Builder
Alternatives
0 PH launches analyzed!

Pricing Table Builder
Create embeddable pricing tables in minutes
422
Problem
Users struggle to create professional pricing tables quickly and effectively.
Existing solutions are time-consuming and may require design skills.
Solution
A web tool that allows users to create embeddable pricing tables within minutes, experiment with different pricing plans quickly, add slider-based price calculation, comparison tables, and more.
Core features include creating professional pricing tables in seconds, experimenting with different pricing plans, adding slider-based price calculation, comparison tables, and all features are 100% free to use.
Customers
Freelancers, small business owners, e-commerce store owners, startups, and marketing professionals.
Specific occupations include marketers, e-commerce managers, startup founders, and freelancers.
Unique Features
Ability to create professional pricing tables quickly, experiment with various pricing setups, and utilize different table formats.
Slider-based price calculation and comparison tables available for enhanced customization.
User Comments
Easy to use and saves time when creating pricing tables.
Great variety of features for customized pricing plans.
Intuitive interface and user-friendly design.
Helps in presenting pricing information effectively.
Responsive support team for any queries or assistance.
Traction
Over 500k pricing tables created on the platform.
Featured in top tech publications like TechCrunch and Mashable.
Positive user reviews averaging above 4.5 stars.
Continuous updates and new features added regularly.
Market Size
The global market for pricing and proposal software was valued at $6.1 billion in 2020.
Expected to reach $10.2 billion by 2025, with a compound annual growth rate of 10.9%.

TablePress ‑ Data Tables
Create data table, import & export table with TablePress
5
Problem
Users need to create data tables for websites, which often requires coding or complex plugins.
creating data tables is time-consuming and often requires technical skills.
Solution
Table builder app
allows users to create data tables like comparison table, pricing table, specification table, size chart, size guide, & embed them to store pages, product pages, and blogs.
Customers
Bloggers, e-commerce store owners, content creators
individuals needing to display organized data on their websites.
Alternatives
View all TablePress ‑ Data Tables alternatives →
Unique Features
No code required for creating tables
Ability to integrate directly with website pages without technical expertise
User Comments
Users find it easy to create and embed tables.
Many appreciate the non-technical approach to table creation.
It's seen as a time-saver for content creators.
The customization options are regarded as beneficial.
Some users mention ease of use as a key advantage.
Traction
Recently launched on ProductHunt
Gaining initial user interest among site builders and bloggers
Market Size
The global data visualization market was valued at $5.9 billion in 2021 and is expected to grow significantly.

CPU Prices
Compare prices and specs in our sortable, filterable table.
8
Problem
Users need to explore CPU prices, specs, and performance in the USA, which can be time-consuming and overwhelming.
Drawbacks: Difficulty in comparing prices, specs, and performance across various CPU models efficiently.
Solution
A web-based platform with a sortable and filterable table to compare CPU prices, specs, and performance in the USA.
Core Features: Explore top CPU prices, compare specs, and filter performance data easily.
Customers
PC builders, gamers, tech enthusiasts, and IT professionals in the USA.
Occupation: PC builders, gamers, tech enthusiasts, IT professionals.
Unique Features
Efficient sortable and filterable table for CPU price, specs, and performance comparison.
Focus on providing centralized, detailed CPU information for better decision-making.
User Comments
Simple and effective tool for comparing CPU prices and specs.
Saved me a lot of time researching before making a purchase.
Great resource for understanding the CPU market in the USA.
User-friendly interface makes it easy to navigate and find relevant information.
Highly recommended for anyone looking to buy a new CPU.
Traction
Growing user base with positive feedback on usability.
Average monthly visits of 50,000+ users.
Continuously adding new CPU models and updates to the platform.
Market Size
$XX billion: Global market size for computer hardware e-commerce in 2021.
Increasing demand for CPUs due to remote work, gaming trends, and digital transformation.

HTML Table Generator
Create clean, responsive HTML tables without writing code
7
Problem
Users need to manually write HTML/CSS code to create responsive tables, which requires coding skills and is time-consuming, especially for non-developers.
Solution
A web-based tool allowing users to generate responsive HTML/CSS tables via a visual editor. Users customize styles, merge cells, and export code instantly.
Customers
Web developers, designers, and non-technical users (e.g., marketers) needing tables for websites, dashboards, or reports.
Alternatives
View all HTML Table Generator alternatives →
Unique Features
Visual editor with real-time preview, responsive design presets (e.g., scrollable tables), and one-click code export.
User Comments
Saves hours of coding
Intuitive interface for non-coders
Mobile-friendly outputs
Useful for collaborative projects
Free tier sufficient for small tasks
Traction
50K+ users, $15k MRR, ranked #1 Product of the Day on ProductHunt with 1.5K+ upvotes. Founder has 2K+ followers on X.
Market Size
The global web development tools market is valued at $11.06 billion in 2023 (Statista).

HTML Table Generator
Create clean, responsive HTML tables without writing code
4
Problem
Users manually code HTML tables or use basic tools, leading to time-consuming processes, errors in code, and lack of mobile responsiveness.
Solution
An online HTML table generator tool where users can create, style, and export responsive tables without coding, offering features like cell merging, CSS styling, and mobile-friendly output.
Customers
Web developers, UI/UX designers, and non-technical content managers needing quick, error-free tables for websites or applications.
Alternatives
View all HTML Table Generator alternatives →
Unique Features
Advanced cell merging, real-time preview, automatic responsive CSS generation, and export to clean HTML/CSS code.
User Comments
Simplifies table creation for non-coders
Saves hours of manual coding
Responsive output works flawlessly
Intuitive interface with customization
No more code validation headaches
Traction
1,000+ upvotes on Product Hunt, $10k MRR, used by 50k+ developers and designers globally, founder has 2.5k followers on X.
Market Size
The global web development tools market is valued at $8.44 billion in 2023 (Statista).

Simple Table
Simple Table: Power Up Your React Grid, Flat Price!
9
Problem
Users face high costs from per-engineer licensing fees when using React data grids, coupled with complexity in integration and scalability limitations.
Solution
A React data grid tool offering features like cell selection, row grouping, infinite scroll, and a flat monthly/yearly pricing model (no per-engineer fees) for cost efficiency.
Customers
React developers and development teams, particularly in startups and SMEs prioritizing budget-friendly, scalable solutions.
Alternatives
View all Simple Table alternatives →
Unique Features
Flat pricing (no per-developer fees), ultra-lightweight (16 kB), and core features like row grouping and infinite scroll out of the box.
User Comments
Affordable alternative to costly grids
Easy integration with React projects
Lightweight and performant
Simplifies complex data management
Transparent pricing model
Traction
Launched on ProductHunt with flat pricing (exact revenue/user metrics not disclosed). React’s npm registry records over 15M weekly downloads, indicating a large potential user base.
Market Size
The global React ecosystem, a key market driver, sees 15M+ weekly npm downloads (React’s npm data), highlighting demand for associated tools.

Create on-brand illustrations
Create two minute reports illustrations
8
Problem
Users need to create brand-consistent illustrations manually for marketing, websites, and social media, which is time-consuming and challenging to maintain visual coherence.
Solution
An AI-powered illustration generator tool that lets users create professional-quality, on-brand visuals in the Two Minute Reports style. Examples: generate marketing assets, social media graphics, and website illustrations using AI to ensure brand consistency.
Customers
Marketing teams, brand managers, social media managers, and content creators seeking quick, cohesive visual content without design expertise.
Unique Features
Specializes in the Two Minute Reports illustration style, AI-driven brand consistency automation, and rapid generation (2-minute turnaround).
User Comments
Saves hours on design work
Perfect for maintaining brand identity
Intuitive interface for non-designers
High-quality output for professional use
Seamless integration with marketing workflows
Traction
Newly launched on ProductHunt (June 2024), featured in top Product of the Day lists, exact user/revenue data unavailable from provided sources.
Market Size
The global $4.5 billion graphic design software market (2023) supports demand for AI-driven branding tools.

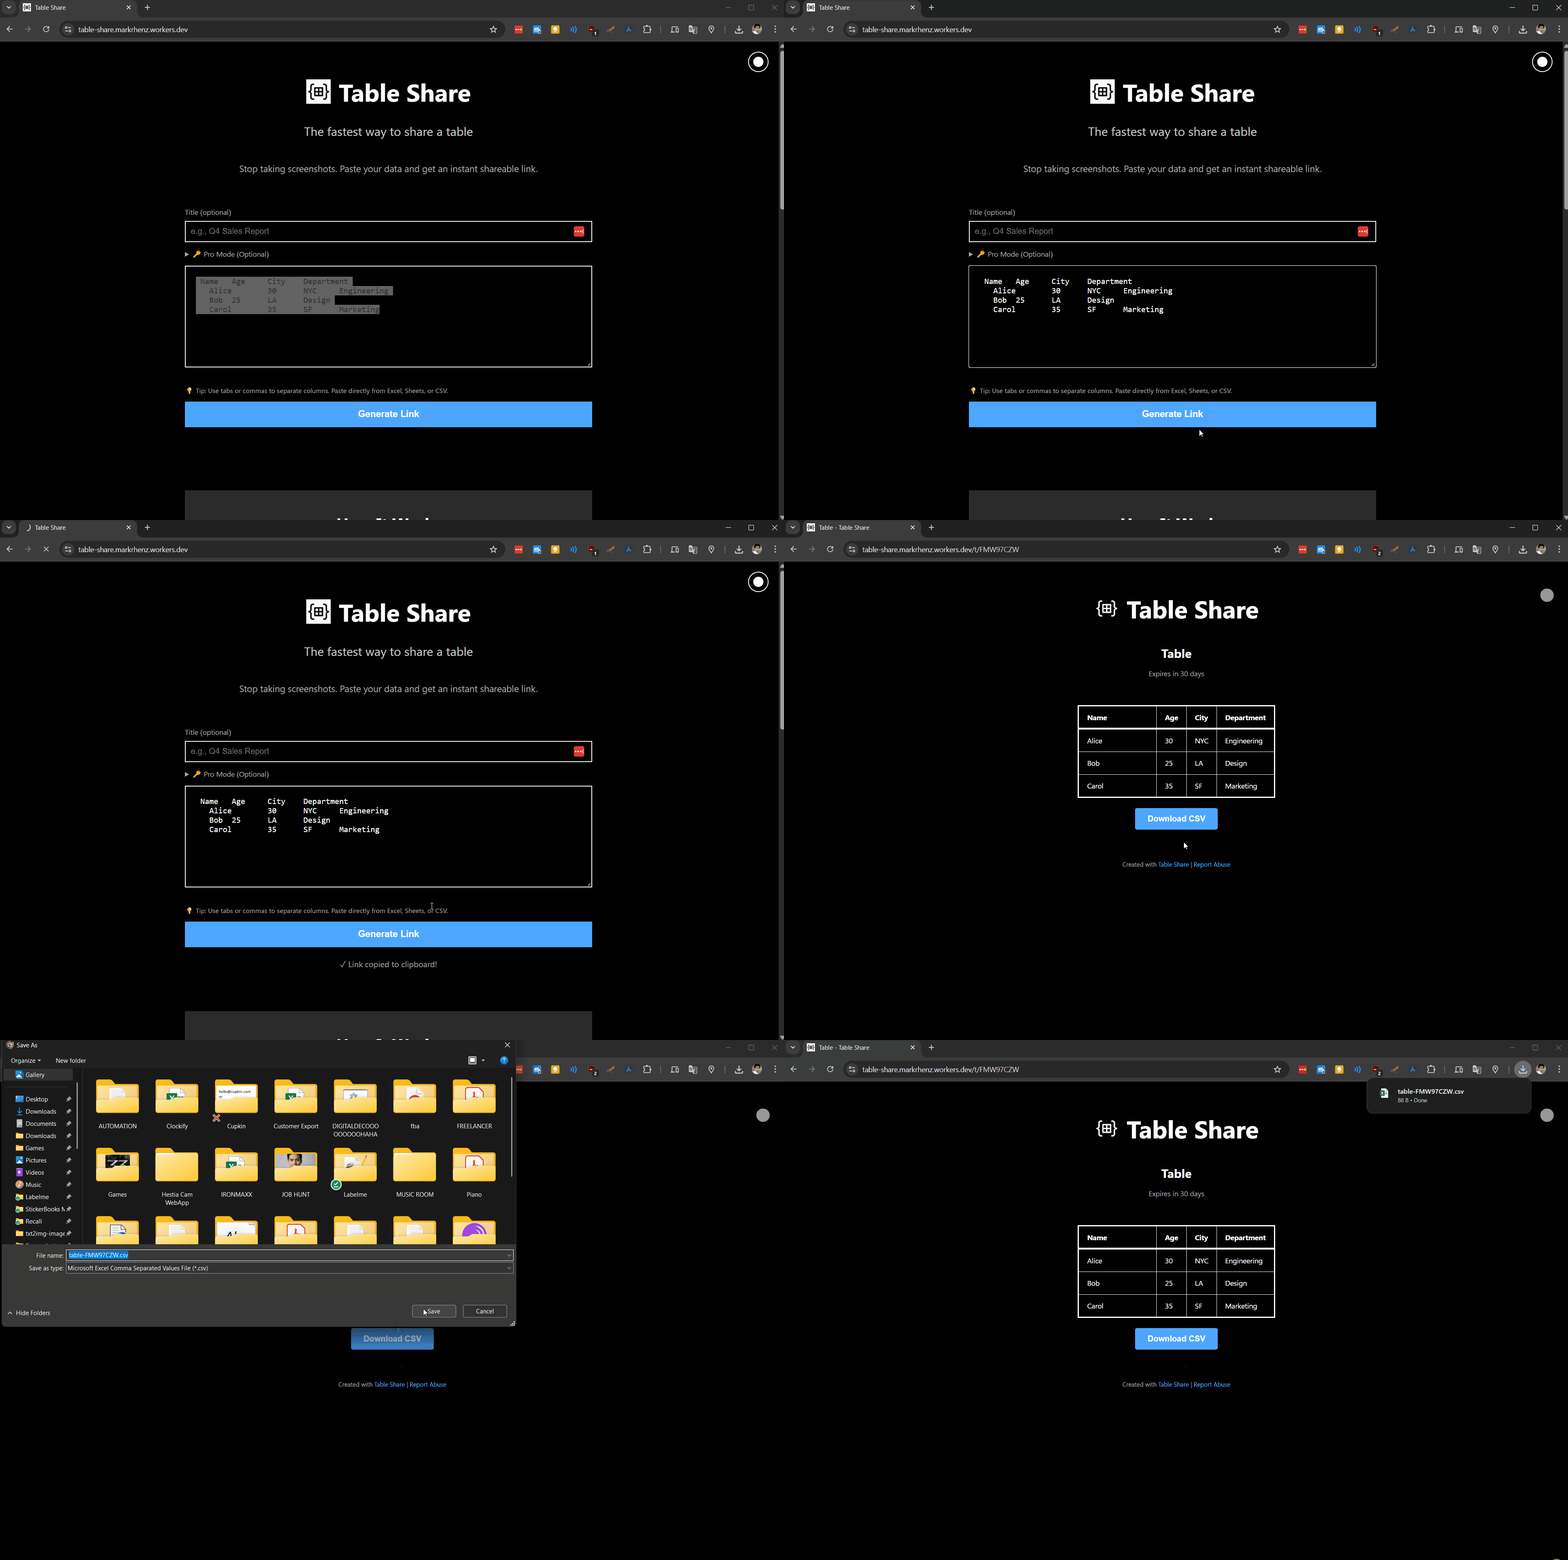
Table Share
The fastest way to share a table
6
Problem
Users share spreadsheets by screenshotting or exporting to static files, which is tedious and lacks interactivity or collaboration
Solution
A web tool enabling quick sharing of structured tabular data via links - users paste data, generate shareable links with optional passwords, and access via API without accounts
Customers
Developers, product managers (PMs), and data analysts needing to collaborate on or present tabular data efficiently
Unique Features
No signup requirement, one-time payment model ($5 PRO), API integration capability, password protection for tables
User Comments
Saves time compared to manual exports
Perfect for secure data collaboration
API access simplifies workflows
Affordable one-time payment model
Simple enough for non-technical users
Traction
FREE plan: 500 rows/table, 7-day expiration | PRO: $5 one-time, 5,000 rows, 90-day expiration | Built by developers with 1.9k PH upvotes
Market Size
Global data visualization market projected to reach $9.12 billion by 2023 (Statista), indicating strong demand for tabular data tools

Price History Extension
Price History Extension: Price Tracker for Amazon & Flipkart
5
Problem
Users struggle to track price changes on Amazon India and Flipkart.
The old solution lacks price tracking tools, price history charts, product tracking, price drop alerts, buying assistance, and AI price prediction.
Solution
A Chrome Extension
Allows users to track price changes on Amazon India and Flipkart with features like price history charts, product tracking, price drop alerts, buying assistance, and AI price prediction.
Customers
Online shoppers in India who frequently purchase products from Amazon India and Flipkart.
Alternatives
View all Price History Extension alternatives →
Unique Features
Price tracking tools for Amazon India and Flipkart
Price history charts
Product tracking functionality
Price drop alerts
Buying assistance
AI price prediction
User Comments
Helps me make informed purchase decisions
Easy to use and provides valuable insights
Saves time and money by tracking price changes effectively
Accurate price predictions based on AI
Highly recommended for online shoppers in India
Traction
Reached 10,000 users within the first month of launch
Featured in top Chrome Extension lists
Positive reviews and ratings on ProductHunt
Market Size
The e-commerce market in India was valued at approximately $84 billion in 2021

Table detection & extraction
Intelligent table detection for instant web table extraction
4
Problem
Users need to manually extract tables from webpages, requiring time and effort to locate and convert tables manual extraction leading to inefficiency and struggling to convert HTML tables into desired formats
Solution
Web-based tool with intelligent table detection automates table extraction, enabling users to instantly detect and extract tables from webpages and convert HTML tables to 30+ formats (e.g., CSV, Excel, JSON)
Customers
Data analysts, researchers, and developers who frequently work with tabular data from web sources
Unique Features
Accurate detection of complex HTML table structures and broad output format support (30+ formats)
User Comments
Saves hours of manual work
High accuracy for nested tables
Seamless format conversion
Easy API integration
Free tier available for testing
Traction
Launched on ProductHunt in 2023 with 1,200+ upvotes
Used by 5,000+ monthly active users
Integrates with Zapier and Airtable
Market Size
The global data extraction software market was valued at $2.5 billion in 2022 (Grand View Research)