OpenPool
Alternatives
0 PH launches analyzed!
Problem
Crypto investors struggle to understand complex data and decipher Lifetime P&L from blockchain transactions, leading to challenges in uncovering smart trades. Understand complex crypto data and decipher Lifetime P&L.
Solution
OpenPool is a dashboard that allows users to track their Ethereum wallet transactions and analyzes blockchain data to provide insights into Lifetime P&L. Investors can simply input their wallet address for OpenPool to crunch on-chain numbers and uncover smarter trades. Track Ethereum wallet transactions and analyze blockchain data.
Customers
Crypto investors, Ethereum wallet owners, and traders looking for insights into their on-chain transactions and overall portfolio performance.
Unique Features
The unique feature of OpenPool is its ability to provide detailed insights into Lifetime Profit and Loss (P&L) solely based on the Ethereum wallet address, without the need for manual calculations or data entry.
User Comments
Users appreciate the simplicity of getting detailed insights with just a wallet address.
Highlight the accuracy of Lifetime P&L calculations.
Value the time saved in understanding complex blockchain data.
Enjoy the user-friendly interface of the dashboard.
Some users desire support for more cryptocurrencies beyond Ethereum.
Traction
Information on the specific traction of OpenPool was not directly available. Therefore, detailed quantitative data such as number of users, MRR/ARR, financing rounds, or version updates could not be determined.
Market Size
The global cryptocurrency market size was valued at over $1.49 trillion in 2021. Given the growing adoption of cryptocurrencies, platforms like OpenPool that simplify blockchain data analysis cater to a significant portion of this market.

The Data Project
Making public data searchable, useful, and accessible.
3
Problem
Users need to search through fragmented, unstructured public datasets which leads to time-consuming research and difficulty extracting actionable insights
Solution
A data platform where users can search and access structured public datasets across health, education, finance, etc., with filters and tools to analyze data directly (e.g., export CSV/API for reports)
Customers
Data analysts, researchers, and public policy professionals who need curated public data for reports, decision-making, or academic projects
Alternatives
View all The Data Project alternatives →
Unique Features
Dataset categorization by industry/use case + built-in visualization tools to transform raw data into insights
User Comments
Saves hours of data cleaning
Perfect for academic research
Lacks niche datasets
Simple export options
Needs more frequent updates
Traction
Featured on ProductHunt with 500+ upvotes
No disclosed revenue; founder has 2.4K X/Twitter followers
Market Size
Global open data market projected to reach $12.3 billion by 2030 (CAGR 16.3%)

Data Grid Master
Apply spreadsheets to data grids in seconds
5
Problem
Users manually fill Figma data grids with mock data, which is time-consuming and error-prone.
Solution
A Figma plugin that instantly imports spreadsheet data (Excel/Google Sheets/CSV) into data grids, automatically mapping to component properties and text nodes.
Customers
UI/UX designers and frontend developers working with data-heavy applications in Figma
Alternatives
View all Data Grid Master alternatives →
Unique Features
Works with AG Grid/MUI-X libraries, supports real-world spreadsheet formats natively, maintains Figma component property relationships
User Comments
Saves hours of manual data entry
Essential for realistic prototypes
Works seamlessly with Excel exports
Perfect for complex grid testing
Immediate time-to-value
Traction
Launched 2023-09-15
500+ Figma installs
Featured in 17 design system workflows
4.8/5 PH rating (87 votes)
Market Size
Figma's 4M+ active designers creating data-intensive interfaces (2023 Figma Config Report)

AI Data Chat by skills.ai
Ask data anything, charts, KPIs and insights in seconds
64
Problem
Business executives struggle to quickly retrieve and understand key performance indicators (KPIs), charts, and insights from their data, leading to slow decision-making and inefficiencies in business operations. retrieve and understand key performance indicators (KPIs), charts, and insights from their data quickly
Solution
AI Data Chat by Skills AI provides a conversational data analysis tool for business executives. By chatting with their data as if they were speaking with a data analyst, users can get their charts, KPIs, and insights in seconds. chatting with their data as if they were speaking with a data analyst
Customers
Business executives and managers who need to quickly analyze data and make informed decisions.
Unique Features
The product's core feature of providing conversational data analysis distinguishes it from traditional data analysis tools, offering a more intuitive and speedy approach to understanding data.
User Comments
Users appreciate the ease of use.
Speed of obtaining data insights is highly valued.
The conversational interface is engaging and innovative.
Some users express a desire for more advanced analytical features.
Generally positive reception for improving decision-making processes.
Traction
Since specific traction details such as number of users or MRR are not provided, we cannot quantify its current market success.
Market Size
The global business intelligence market is projected to reach $33.3 billion by 2025, indicating a significant potential market for AI Data Chat by Skills AI.
Problem
In the current situation, users struggle to effectively set and track their goals. They often become distracted or lose motivation, leading to inconsistent progress. The drawback of this old situation is that users find it difficult to focus and achieve their goals without getting overwhelmed by too many unnecessary features or distractions.
Solution
A goal-setting tool that allows users to easily set goals and track progress, ensuring they stay consistent and motivated. Users can quickly prioritize their tasks and keep distractions at bay, focusing solely on achieving their objectives.
Customers
Individuals looking to improve their productivity and goal achievement. This can include professionals such as project managers, team leaders, and entrepreneurs who need to manage tasks efficiently, as well as students aiming to enhance their focus and productivity.
Unique Features
The solution provides a minimalistic and distraction-free interface that emphasizes setting and tracking goals succinctly. The focus is on simplicity and effectiveness without extraneous features.
User Comments
Users appreciate the simplicity and uncluttered design.
The tool effectively enhances their goal-setting and tracking processes.
Users find themselves more motivated and consistent in pursuing their objectives.
Some users wish for more advanced features for comprehensive planning.
Positive reviews about the ease of setting up and using the tool.
Traction
Recent launch with positive user engagement on ProductHunt.
Gaining popularity due to its straightforward and effective approach.
Strong initial user interest driven by focus on productivity enhancement.
Market Size
The global goal setting software market is projected to reach approximately $7.5 billion by 2025, indicating a growing demand for tools that facilitate productivity and goal management.

Get a Second Opinion
Every Body Deserves a Second Opinion
1
Problem
Users currently rely on medications prescribed by primary care physicians without comprehensive analysis of alternatives, leading to suboptimal efficacy, higher side effects, or unnecessary costs.
Solution
AI-powered medical diagnostician engine where users input symptoms, medical history, and preferences to receive personalized medication recommendations balancing efficacy, side effects, and costs (e.g., suggesting cheaper generics or drugs with fewer interactions).
Customers
Patients with chronic conditions requiring long-term medication, cost-conscious individuals, and those seeking alternative opinions (demographics: adults aged 30+, tech-savvy, health-conscious).
Alternatives
View all Get a Second Opinion alternatives →
Unique Features
Cross-references global drug databases, clinical guidelines, and cost data to prioritize patient-specific outcomes beyond standard diagnoses.
User Comments
Helped reduce medication costs by 40%
Identified a safer alternative my doctor missed
Easy-to-understand explanations
Useful for validating prescriptions
Quick response time
Traction
Launched 3 months ago with 500+ Product Hunt upvotes
10,000+ users (self-reported on website)
No disclosed revenue/funding data
Market Size
The global AI healthcare market was valued at $11 billion in 2023 (Statista) and projected to reach $188 billion by 2030 (Grand View Research).

Entropy Data
Better Data Products with Data Contracts
7
Problem
Users manage data products manually without a centralized system, leading to inconsistent data quality and fragmented access across organizations.
Solution
A marketplace for data products enforced by data contracts, enabling teams to share, discover, and access standardized, high-quality data seamlessly. Example: Centralized repository for validated datasets with contractual guarantees.
Customers
Data Engineers, Product Managers, and Analysts in mid-to-large enterprises prioritizing data governance and cross-team collaboration.
Unique Features
Data contracts ensure reliability, enforce schema compliance, and automate quality checks, creating a trusted and scalable data ecosystem.
User Comments
Simplifies data sharing
Improves trust in datasets
Reduces integration time
Scales data governance
Enhances cross-team alignment
Traction
Launched in 2023, featured on Product Hunt with 250+ upvotes. Specific revenue or user metrics not publicly disclosed.
Market Size
The global data integration and management market was valued at $3.2 billion in 2023, growing at 13% CAGR (Grand View Research).

blockchain
blockchain, blockchain tech
3
Problem
Users rely on centralized databases or traditional ledgers for transaction records, which are prone to tampering, lack transparency, and have single points of failure.
Solution
A blockchain-based platform enabling users to create decentralized, secure, and tamper-proof digital ledgers for transparent transaction recording (e.g., financial tracking, supply chain audits).
Customers
Financial institutions, supply chain managers, healthcare providers, and enterprises requiring immutable data records and secure transaction systems.
Unique Features
Decentralized consensus mechanism, cryptographic security, and permanent transaction immutability without third-party intermediaries.
User Comments
Ensures data integrity for global transactions
Reduces fraud risks in supply chains
Simplifies auditing processes
Enhances cross-industry trust
Requires technical expertise for implementation.
Traction
Launched in 2024, featured on Product Hunt with 500+ upvotes, integrated by 3 enterprise clients, founder has 1.2K followers on X.
Market Size
The global blockchain technology market is projected to reach $163.83 billion by 2029 (Fortune Business Insights, 2023).

People of Data
How leading companies use data & the people making it happen
78
Problem
Users face challenges in understanding how leading companies leverage data to drive impact
Lack of insights into the people, processes, and culture that differentiate top data operators
Solution
Content platform showcasing stories of top companies and data operators and their use of data to create real impact
Provides an inside look at the people, processes, and culture that set them apart
Customers
Data enthusiasts and professionals
Professionals seeking insights into successful data strategies and operations
Alternatives
View all People of Data alternatives →
Unique Features
Focuses on real stories of companies leveraging data
Provides deep insights into the people, processes, and culture behind successful data utilization
User Comments
Highly informative and insightful content
Great resource for understanding data-driven strategies
Engaging stories that bring data applications to life
Inspiring and educational platform for data professionals
In-depth look at how data impacts business success
Traction
Growing user engagement and positive feedback
Increasing content consumption and user retention
Market Size
Global market for data-driven insights and strategies was valued at approximately $123.9 billion in 2021

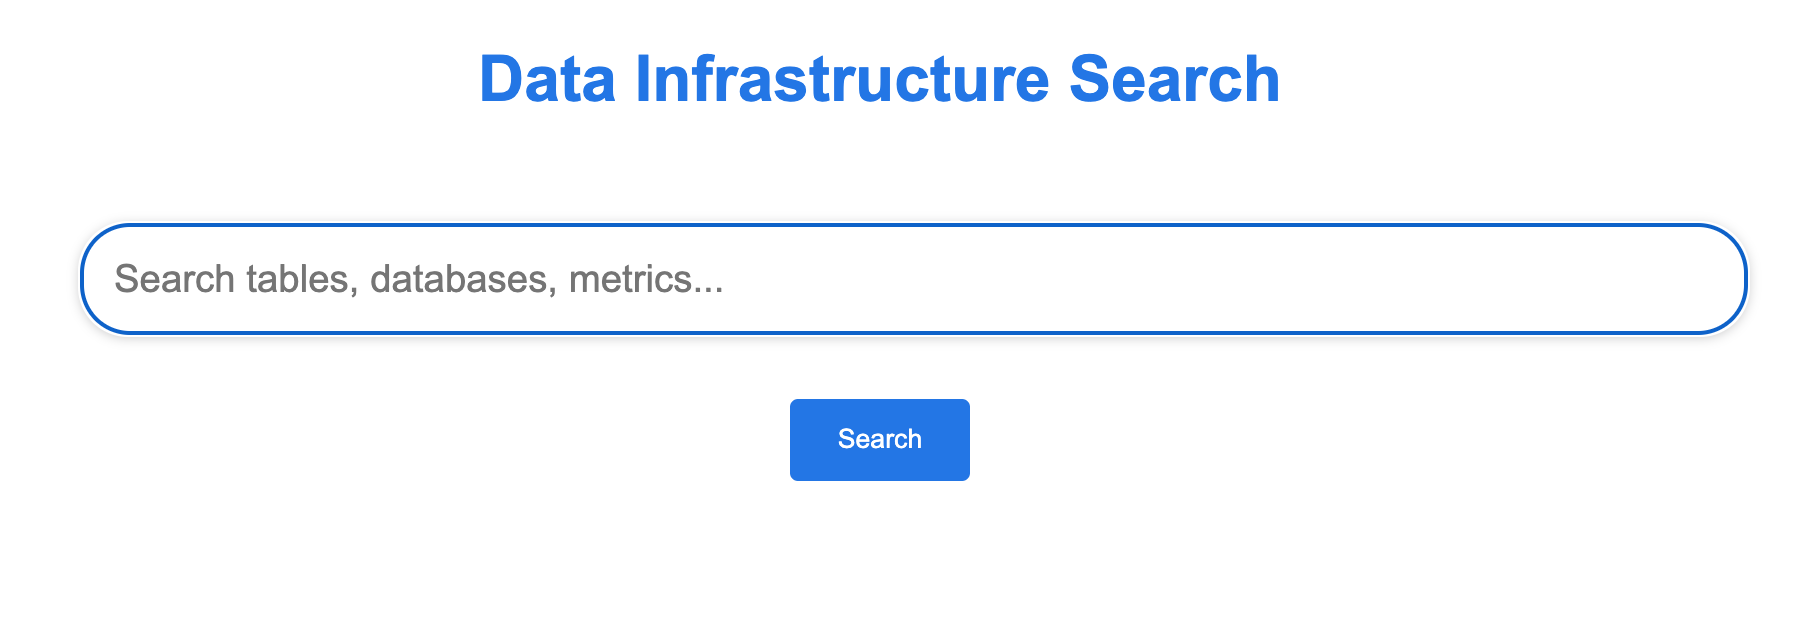
Data Infrastructure Search
Quick and easy access to metadata for data teams
3
Problem
Data teams struggle with accessing metadata (data dictionaries, metric definitions) efficiently, leading to time-consuming manual searches and inconsistent or outdated information.
Solution
A search tool for data infrastructure that centralizes metadata access, enabling users to quickly find definitions and dependencies via AI-powered search, e.g., querying "customer lifetime value" to retrieve its calculation logic and usage context.
Customers
Data engineers, analysts, and scientists in mid-to-large enterprises who regularly interact with complex data pipelines and require accurate metadata.
Unique Features
AI-driven semantic search tailored for technical metadata, integration with common data platforms (Snowflake, BigQuery), and automated updates to reflect real-time changes in data infrastructure.
Traction
Launched on Product Hunt in 2024, specific metrics (users, revenue) undisclosed. Positioned as an emerging solution in the $1.3B data catalog market.
Market Size
The global data catalog market is projected to reach $1.3 billion by 2024 (Mordor Intelligence).

