Matrix Solver Step by Step
Alternatives
0 PH launches analyzed!

Matrix Solver Step by Step
Linear Algebra Visual Guide
7
Problem
Students studying Linear Algebra often solve matrix problems manually or with basic calculators, leading to time-consuming processes, high error rates, and limited understanding of underlying concepts.
Solution
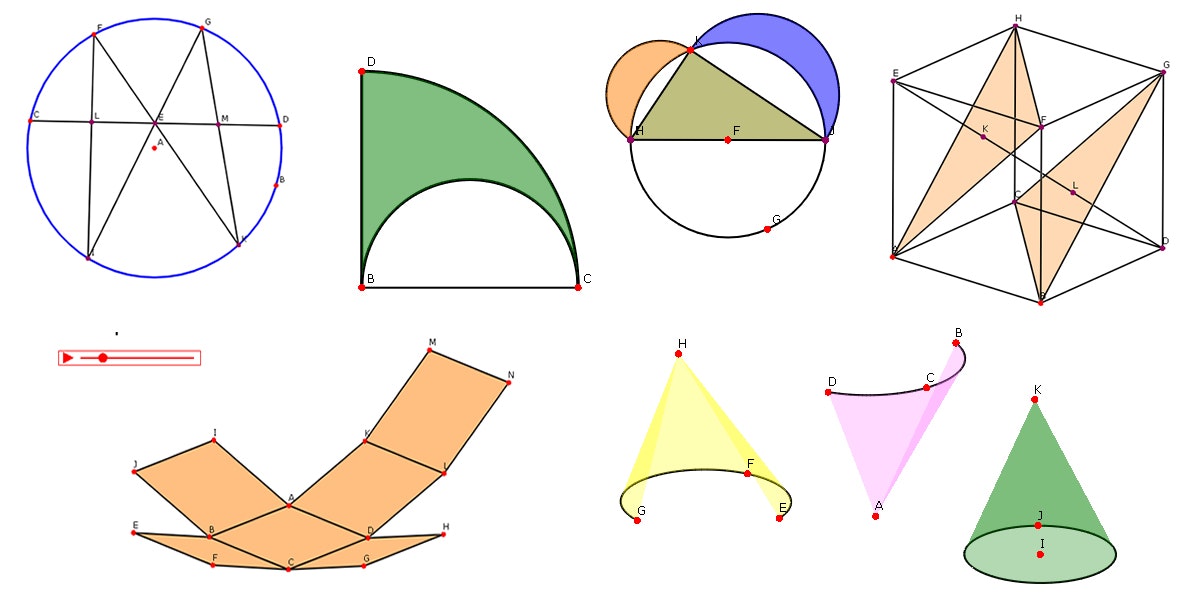
A web-based matrix calculator with step-by-step visual explanations, allowing users to input matrices and receive solutions alongside interactive visualizations of row operations, determinants, and inverses (e.g., solving systems of equations or eigenvalue problems).
Customers
High school to college students in STEM fields requiring linear algebra problem-solving and educators seeking teaching/visualization tools.
Alternatives
Unique Features
Combines computational matrix-solving with real-time visual guides, making abstract concepts tangible through animations and step breakdowns.
User Comments
Simplifies complex matrix operations
Visual steps enhance comprehension
Saves time on homework
Free alternative to expensive tools
Occasional calculation lag
Traction
Launched on ProductHunt (exact upvotes/revenue unspecified); positioned as a free educational tool likely in early adoption phase.
Market Size
The global STEM education market, which includes linear algebra tools, was valued at $89.5 billion in 2023 (HolonIQ).

Visual Math
A mathematical software suite featuring 10+ applications.
0
Problem
Users struggle with managing multiple tools for different mathematical areas, leading to inefficiency, fragmentation, and difficulty in mastering interdisciplinary concepts.
Solution
A comprehensive mathematical software suite with 10+ integrated applications, enabling users to handle AI, geometry, algebra, calculus, data visualization, and more within a single platform. Examples: calculus problem-solving, data fitting, and 3D graphing.
Customers
Middle school, high school, and university students and teachers seeking an all-in-one tool for learning, teaching, or solving complex mathematical problems across disciplines.
Unique Features
Combines AI-powered analysis with domain-specific tools (e.g., optimization methods, complex functions) in one interface, eliminating the need for separate software for each mathematical field.
User Comments
Saves time by consolidating tools
Enhances understanding through visualization
Useful for advanced and beginner topics
Simplifies interdisciplinary projects
Supports both theoretical and applied math
Traction
Launched on ProductHunt with 100+ upvotes within 24 hours. Exact revenue/user metrics unavailable, but positioned as a niche educational SaaS tool.
Market Size
The global math software market is projected to reach $11.5 billion by 2027, driven by STEM education growth (Source: MarketsandMarkets).

Guide Gleam
Instant AI-powered step-by-step guides with GuideGleam.
6
Problem
Users struggle to create visual instructions and convert images into easy-to-follow guides
Lack of AI-driven guide creation
Difficulty in customizable content
Inability to easily share in a PDF format
Lack of context search for quick information retrieval
Solution
Web tool for creating visual instructions and converting images into step-by-step guides
Users can leverage AI-driven guide creation, customize content, share in PDF format, and utilize context search for quick info retrieval
AI-driven guide creation
Customizable content
Shareable PDF format
Context Search for quick information retrieval
Customers
Content creators, educators, technical writers, software developers
Technical writers
Alternatives
View all Guide Gleam alternatives →
Unique Features
AI-driven guide creation, customizable content, shareable PDF format, context search
AI-driven guide creation
User Comments
Easy-to-use tool for creating step-by-step guides
AI feature saves time and effort
Useful for sharing knowledge and instructions visually
Great for creating tutorials and how-to guides
Helps streamline and simplify content creation process
Traction
500k users on the platform
Positive reviews and ratings on ProductHunt
Market Size
Niche market for visual instruction tools was valued at approximately $2.5 billion in 2021

Visual Study Guide
Turn notes into visual masterpieces
1
Problem
Users struggle to organize and convert handwritten or text-based notes into structured, visually engaging study materials, leading to inefficient learning and difficulty retaining complex information.
Solution
A web-based study tool that uses AI to transform notes into visual diagrams, flashcards, and infographics. Users upload notes and receive organized, interactive study aids (e.g., flowcharts for biology concepts, timeline-based history summaries).
Customers
Students, particularly in higher education, and educators seeking to create digestible study materials. Demographics: aged 16–30, tech-savvy, frequent note-takers.
Unique Features
AI-powered visual structuring with adaptive templates for different subjects (e.g., STEM vs. humanities), real-time collaboration for group study, and export options for flashcards.
User Comments
Saves hours of manual note organization
Makes revision sessions more interactive
Improves retention of dense topics
User-friendly interface for non-designers
Wish it had more subject-specific templates
Traction
Launched 3 months ago with 400+ ProductHunt upvotes; 10,000+ registered users, 30% monthly growth. Founder actively engages on X (2,500+ followers).
Market Size
The global e-learning market is projected to reach $400 billion by 2026, with study-aid tools being a key growth segment.

Quick Guides
Create free How-to Guides from your browser as you click!
13
Problem
Users manually compile screenshots and annotate steps to create tutorials, leading to time-consuming and inefficient guide creation.
Solution
A Chrome extension tool that automatically generates step-by-step guides with highlights and screenshots as users interact with their browser. Users can record clicks and share unlimited guides.
Customers
Content creators, customer support teams, and educators who need to create tutorials or documentation quickly.
Unique Features
Real-time browser action recording, automatic screenshot capture, and instant guide generation without manual editing.
User Comments
Simplifies tutorial creation process
Saves hours of manual work
Intuitive browser integration
Free and unlimited guides
Useful for onboarding and training
Traction
Launched on ProductHunt with 1,800+ upvotes, featured in Chrome Web Store with 10,000+ installs. Free model with no disclosed revenue.
Market Size
The global e-learning market size was valued at $400 billion in 2023, driven by demand for instructional content creation tools.
Body Visualizer
Body Visualizer
5
Problem
Users struggle to achieve their fitness goals and track their progress precisely. Lack of visual tools can lead to less motivation and inaccurate self-assessment.
Solution
Body Visualizer is an AI-powered 3D visualization tool that helps users set fitness goals, track progress, and achieve their ideal body shape with scientific precision. Users can visualize their transformation and track specific body metrics.
Customers
Fitness enthusiasts, personal trainers, health coaches, and individuals focused on body transformation and fitness progress tracking.
Unique Features
AI-powered 3D visualization
Scientific precision in progress tracking
Customizability of fitness goals and metrics
User Comments
Visually appealing and motivating
Tracks progress accurately
User-friendly interface
Helpful for personal trainers
Improves fitness accountability
Traction
Recently launched
Featured on ProductHunt
Market Size
The global fitness app market was valued at $4.4 billion in 2020 and is expected to grow significantly in the coming years.

Visual ChatGPT
Talking, drawing and editing with visual foundation models
88
Problem
Users find it challenging to interact with AI solely through text when their queries involve visual contexts, leading to limited understanding and responses from the AI. Interacting with AI using both text and images.
Solution
Visual ChatGPT is an advanced interaction platform that combines talking, drawing, and editing with visual foundation models. It enables users to communicate with ChatGPT using both words and images, effectively addressing complex visual questions and multi-step instructions. The integration of various visual models with ChatGPT enhances the AI's learning with the aid of pictures. Communicate with ChatGPT using both words and images.
Customers
Researchers in AI and computer vision, educators looking to integrate AI into visual learning, and developers creating applications that require understanding of visual context.
Alternatives
View all Visual ChatGPT alternatives →
User Comments
Impressed by the innovative combination of text and visual inputs.
Enhances the usability of ChatGPT for visual tasks.
Great tool for educational purposes.
A significant step forward in AI interaction.
Useful for developers integrating AI into visually driven apps.
Traction
As the product is relatively new and specifics about user metrics or financials are not publicly disclosed, concrete numbers regarding traction are unavailable.
Market Size
The AI in computer vision market is expected to grow from $6.6 billion in 2021 to $144.46 billion by 2028.

Visual CSS
Visual CSS Collaborate with Intelligence. No coding Required
3
Problem
Users manually edit CSS code with technical expertise to modify website designs, leading to time-consuming processes and limited design experimentation. manually editing CSS code with technical expertise
Solution
A no-code visual editor tool enabling users to style websites via AI-generated CSS. visually edit website styles in real-time without coding, generating clean CSS code via AI
Customers
Web designers, front-end developers, and digital marketers seeking rapid prototyping or design iteration without deep coding knowledge.
Unique Features
AI generates clean, maintainable CSS code; real-time collaboration; visual editing directly on live websites.
User Comments
Saves hours of manual coding
Intuitive for non-developers
Collaboration features streamline feedback
AI outputs production-ready code
Real-time editing speeds up iterations
Traction
Launched on ProductHunt in 2023; specific metrics (MRR, users) not publicly disclosed.
Market Size
The global web design market, driven by no-code tools, was valued at $40 billion in 2022 (Statista, 2023).

Visual Comparison
Seamless Visual QA: Compare, Detect, Highlight Changes
3
Problem
Users manually validate UI changes and detect visual regressions, which is time-consuming and error-prone due to human oversight.
Solution
A Python-based visual testing tool that uses OpenCV to compare images with pixel-level accuracy, automatically highlighting differences with red rectangles for quick UI validation and design consistency checks.
Customers
QA engineers, developers, and UI/UX designers working on web/app development teams requiring precise visual regression testing.
Alternatives
View all Visual Comparison alternatives →
Unique Features
OpenCV-powered pixel-level comparison, automated difference highlighting, Python integration for scriptable workflows, and standalone visual QA capabilities without third-party dependencies.
User Comments
Saves hours in UI testing workflows
Pixel-accurate detection of subtle layout shifts
Easy integration with existing Python scripts
Lacks browser-native automation features
Requires basic OpenCV/Python knowledge
Traction
Launched on ProductHunt with 110+ upvotes (as of 2023), open-source GitHub repository with 320+ stars, used by 50+ dev teams according to website claims
Market Size
The global software testing market reached $40 billion in 2022 (Statista), with visual UI testing comprising a growing segment driven by increased cross-device compatibility demands.

CSV Data Visualizer
CSV Visualizer: Turn raw data into stunning visuals fast! 📊
5
Problem
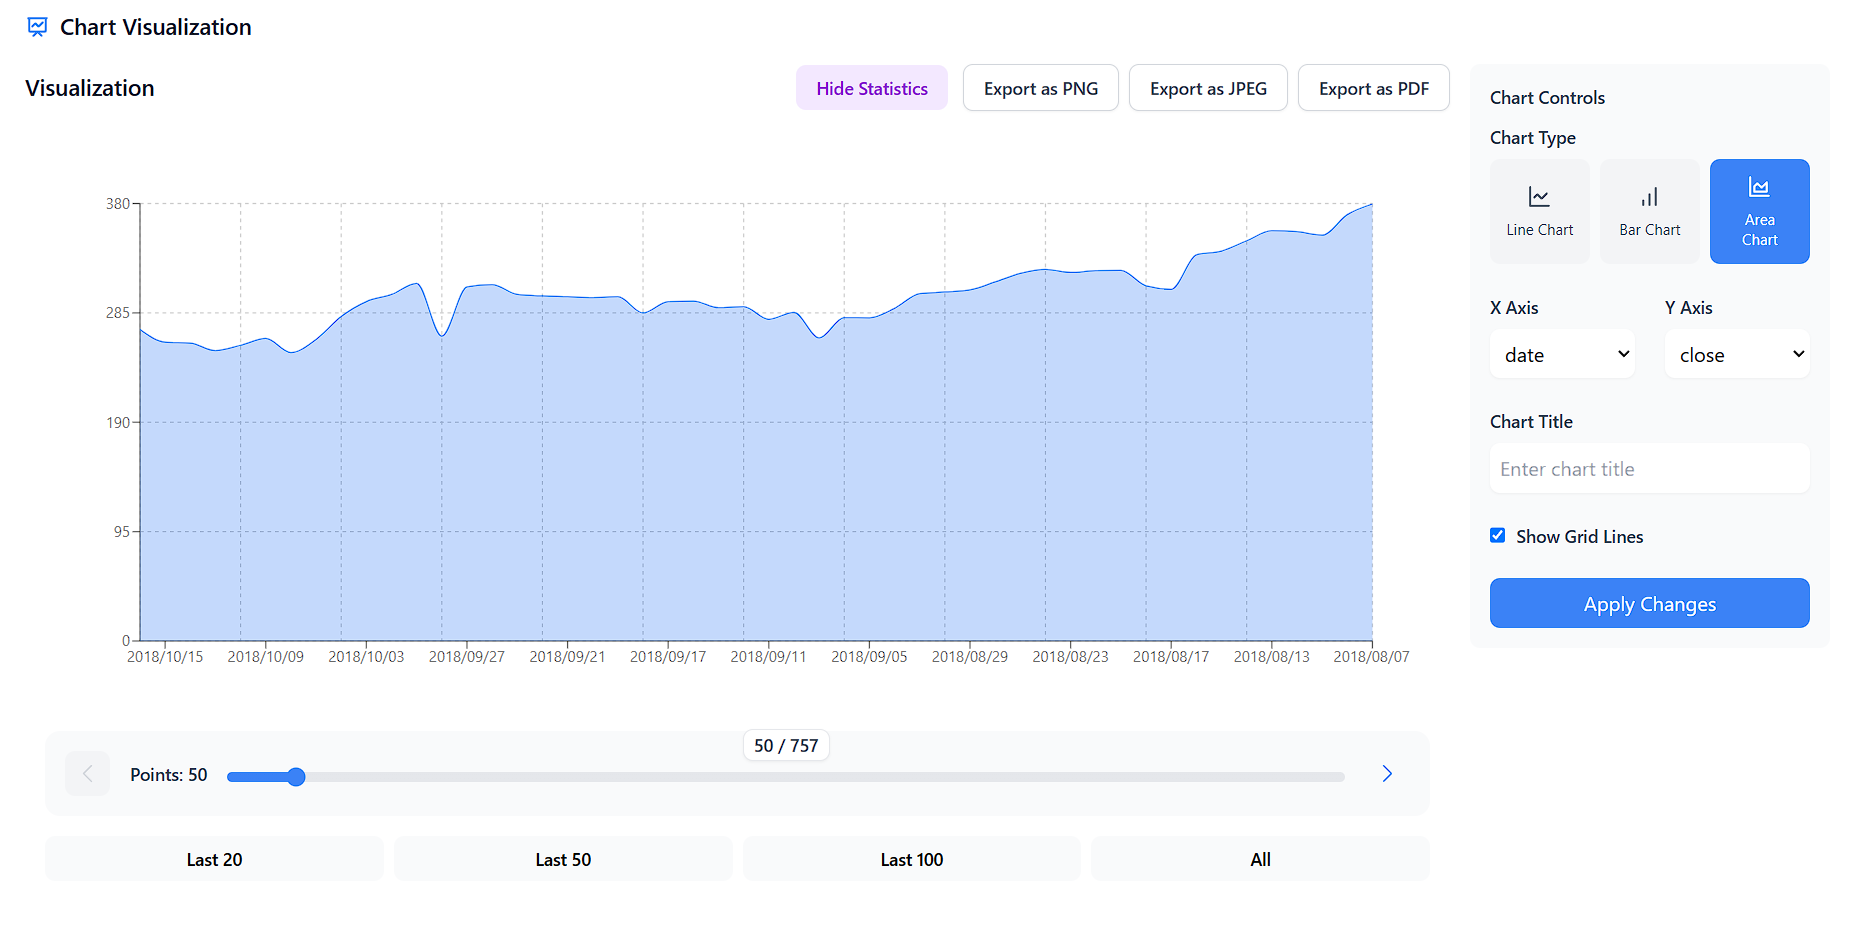
Users often struggle to visualize CSV data and create compelling visuals quickly.
Existing solutions for data visualization may be complex, time-consuming, and require a steep learning curve.
Solution
Web-based CSV Data Visualizer tool
Users can quickly turn raw data into stunning visuals in seconds without the need for subscriptions or hidden fees.
Core features include: fast data visualization, user-friendly interface, no subscriptions or fees.
Customers
Students, analysts, and data geeks who need to visualize CSV data quickly and effectively.
Alternatives
View all CSV Data Visualizer alternatives →
Unique Features
Fast data visualization in seconds
No subscriptions or hidden fees, 100% free online tool.
User Comments
Intuitive tool for quick data visualization.
Great for students and data analysts.
The free offering is a significant advantage.
Simple and effective solution for visualizing CSV data.
User-friendly interface for creating stunning visuals.
Traction
Over 5,000 users registered within the first week of launch.
Continuously improving features based on user feedback.
No specific revenue data provided.
Market Size
Global data visualization market size was estimated at $5.9 billion in 2020, and it is projected to reach $10.2 billion by 2025 with a CAGR of 11.6%.