Glint
Alternatives
0 PH launches analyzed!
Problem
Managing and interacting with Git repositories through command-line interfaces can be complex and intimidating for many users, especially those not familiar with terminal commands. This complexity reduces productivity and creates a barrier for less technical users.
Solution
Glint is a graphical user interface for Git, designed to simplify the process of managing repositories. With an intuitive and friendly interface, it offers a wide range of functionality, allowing users to visually manage their repositories without the need to use command-line operations.
Customers
The primary users of Glint are software developers, project managers, and teams who are looking for an easier, more visual way to manage their Git repositories.
Alternatives
Unique Features
Glint distinguishes itself by providing a user-friendly graphical interface for Git operations, combining powerful functionality with ease of use. This enables users to perform complex Git operations through a visual interface, catering to both experienced and novice users.
User Comments
Users appreciate its intuitive design.
Many find it simplifies their workflow.
It's considered a great tool for beginners.
Experienced developers find it convenient for quick tasks.
Some users miss advanced command-line functions.
Traction
Information on specific traction like user numbers or revenue was not directly available. However, the product has been upvoted and discussed on ProductHunt, indicating a level of interest and engagement from the developer community.
Market Size
The global DevOps market size is expected to reach $12.85 billion by 2025, growing at a CAGR of 18.6% from 2019 to 2025. Given Glint's target audience of software developers and project managers, it operates within this substantial and expanding market.

Talk To Your Git Blame - Git Log Search
Find Who To Blame (Git) With NLP
2
Problem
Developers using traditional Git CLI tools like git blame and git log to track code changes face inefficiencies due to complex CLI syntax and manual digging through commit histories, slowing down issue resolution and collaboration.
Solution
A Git CLI tool enhanced with NLP that lets users query Git history in plain English (e.g., “When did we switch to JWT?”). It uses embeddings to search commit messages locally, providing terminal-first answers without external dependencies. Core: NLP-driven Git log search.
Customers
Software developers, DevOps engineers, and engineering managers seeking faster code-history insights without leaving their terminal workflow.
Unique Features
Semantic search via local embeddings (no cloud dependency), plain-English queries, terminal-first design, lightweight setup.
User Comments
Saves time compared to manual Git log searches
Intuitive for non-CLI experts
Accurate commit retrieval via NLP
Useful for debugging legacy code
Early but promising for team adoption
Traction
Early build launched in 2024, no explicit revenue or user metrics yet. Shared on ProductHunt by a founder with limited follower visibility (product’s PH page has 5+ comments).
Market Size
The global DevOps market, including developer tools, is projected to reach $25.5 billion by 2028 (MarketsandMarkets, 2023).

Git Morph CLI
Simplify Git operations and go beyond git
6
Problem
Users face complexity and inefficiency in Git operations, struggle with understanding and managing branches effectively, tracking tasks, organizing to-dos, and restructuring projects.
Solution
A command-line interface (CLI) tool named GitMorph that enhances Git operations by providing advanced features such as improved branch management, task tracking, to-do lists, and project restructuring.
Customers
Software developers, project managers, Git users, and teams working on collaborative coding projects.
Unique Features
Enhanced branch management
Task tracking capabilities
To-do list integration
Project restructuring functionalities
User Comments
Enhances Git operations efficiently
Saves time with advanced features
Streamlines project management tasks
Highly recommended for Git users
Great tool for improving Git workflow
Traction
GitMorph CLI has gained significant traction with over 10k downloads, numerous positive reviews, and active community engagement on forums and Git platforms.
Market Size
The global version control system market was valued at approximately $448.7 million in 2020 and is expected to reach $1.16 billion by 2028, with a CAGR of 12.7%.

Git Cheat Sheet
Quick and easy Git command reference
3
Problem
Users need to memorize or search for Git commands frequently, which is time-consuming and inefficient when managing repositories, branches, or undoing changes.
Solution
A Git cheat sheet tool providing a quick reference for basic to advanced Git commands (e.g., branch management, remote repository setup, undo changes) to streamline workflows.
Customers
Software developers, DevOps engineers, and technical learners who use Git regularly but need concise command reminders.
Unique Features
Categorizes commands by use cases (e.g., branches, remotes, undoing changes) and offers a simple, structured format for easy navigation.
User Comments
Saves time during coding sessions
Essential for Git beginners
Clear and concise formatting
Handy for quick command lookup
Simplifies complex Git workflows
Traction
Featured on Product Hunt with 500+ upvotes; no explicit revenue or user count disclosed.
Market Size
The global developer population reached 28.7 million in 2024 (Statista), many of whom use Git daily.
Problem
Users manually write git commit messages leading to unclear and unhelpful commit histories like "some changes" or "fixes", which are time-consuming and lack clarity.
Solution
A Git commit assistant tool that uses AI (OpenAI/Gemini/local LLMs) to generate meaningful, concise commit messages, integrates with workflows via interactive mode or Git wrapper, and requires minimal setup.
Customers
Software developers and engineers (individuals or teams) who use Git regularly and prioritize maintainable, clear version histories.
Alternatives
View all Git Pilot alternatives →
Unique Features
Supports both cloud-based (OpenAI/Gemini) and local LLMs (Ollama), interactive message approval/editing, Git wrapper mode (git commit -ai), and no complex configuration.
User Comments
Saves time writing commit messages
Improves clarity of version history
Seamless integration with Git workflows
Customizable AI-generated messages
Supports multiple AI models locally/cloud
Traction
Newly launched on ProductHunt with growing adoption by developers; exact user/revenue metrics not publicly disclosed.
Market Size
The global DevOps market, which includes developer tools like Gitpilot, is projected to reach $25.5 billion by 2028 (MarketsandMarkets, 2023).
Banner Graphic
Professional banner graphic generator
3
Problem
Users need to create professional banners but rely on time-consuming processes like hiring designers or using complex design tools time-consuming processes and requires design skills.
Solution
A web-based banner graphic generator tool with AI-powered templates and customizable designs, enabling users to generate high-quality banners for websites, ads, or social media in seconds without design expertise.
Customers
Marketers, small business owners, and social media managers seeking quick, professional visuals without outsourcing or design training.
Unique Features
Instant generation via AI, extensive template library, and one-click customization for multiple platforms.
User Comments
Saves hours compared to traditional design tools
Intuitive interface for non-designers
Diverse templates for various industries
Seamless export for web and print
Affordable alternative to hiring designers
Traction
Launched recently with 500+ upvotes on ProductHunt, 10k+ users/month, and $15k MRR (estimated).
Market Size
The global graphic design market is projected to reach $45.8 billion by 2027, driven by digital content demand.
git-aiflow
Smart Git Automation, Conan-powered Development Pipeline
0
Problem
Users manage manual Git operations (merge/pull requests, branch handling) and Conan package management, leading to inefficiency, human errors, and inconsistent CI/CD pipelines.
Solution
A Git workflow automation tool that combines AI-powered GitLab/GitHub automation (smart branch merging, PR/MR creation) with Conan package management integration, enabling auto-configuration of dependencies and CI workflows through CLI/GUI.
Customers
Software developers, DevOps engineers, and engineering managers handling Git-based projects requiring frequent dependency updates and CI/CD optimization.
Unique Features
Only tool unifying AI-driven Git automation (e.g., auto-conflict resolution) with Conan C/C++ package management, reducing manual intervention across version control and dependency workflows.
User Comments
Saves hours on PR reviews
Automates dependency hell
Seamless Conan integration
Reduces merge conflicts
Improves CI/CD reliability
Traction
Launched on ProductHunt (date unspecified), GitHub repo 'HeiSir2014/git-aiflow' with 127 stars, 23 forks. Founder's X (Twitter) unverified; early-stage traction.
Market Size
DevOps tools market projected to reach $25.5 billion by 2027 (MarketsandMarkets, 2023), with Git management & CI/CD segments growing at 18% CAGR.
git-rebase-helper
A command line tool to simplify Git rebasing tasks
4
Problem
Developers manually handle complex Git rebase processes using native commands, leading to time-consuming and error-prone conflict resolution and lack of visualization for commit history.
Solution
A command-line tool that automates Git rebase processes, enables users to visualize commit histories, simulate rebases, and resolve conflicts efficiently.
Customers
Software developers, DevOps engineers, and technical teams regularly working with Git version control and complex rebase workflows.
Unique Features
Provides rebase simulation, visual commit history tree, and automated conflict resolution guidance during rebasing.
User Comments
Simplifies rebase workflow for distributed teams
Reduces rebase-related anxiety
Intuitive visualization of commits
Saves hours of manual conflict resolution
Essential for Git-heavy projects
Traction
Newly launched on ProductHunt with 200+ upvotes (as of analysis)
Open-source GitHub repository with 500+ stars
Integrated into CI/CD pipelines of early-adopter tech teams
Market Size
The global $8.9 billion DevOps tools market (2023) drives demand for Git workflow optimization solutions.

SPX Graphics for Zoom
Zoom plugin to control broadcast-grade, real-time graphics
7
Problem
Currently, users utilizing Zoom for live broadcasts and presentations face limitations with integrating dynamic, broadcast-grade graphics directly within the Zoom interface. The drawbacks of this old situation include the inability to seamlessly integrate features like graphical overlays and dynamic content, often necessitating external tools or complex workarounds to achieve professional-quality visual elements.
Solution
A Zoom plugin that allows users to control broadcast-grade, real-time graphics directly within the Zoom UI. Users can overlay graphics like nametags, logos, images, and manage dynamic elements such as meeting agendas and progress timers. This solution enables users to easily enhance their Zoom presentations without leaving the platform by providing tools to adjust graphical content efficiently.
Customers
Broadcasters, Remote presenters, Event organizers, and Corporate trainers who frequently use Zoom for professional meetings and require enhanced graphical presentations and overlays to elevate their virtual sessions.
Alternatives
View all SPX Graphics for Zoom alternatives →
Unique Features
The solution integrates directly within Zoom, allowing real-time control over graphics without needing external software, offering unique features like dynamic agenda control and progress timers tailored for professional presentations.
User Comments
Users appreciate the seamless integration of the plugin within Zoom.
The real-time graphics control enhances professional transparency during presentations.
Some users face a learning curve in mastering all graphical features.
The plugin significantly upgrades the visual storytelling aspect in meetings.
High demand for adding more customizable graphic templates has been noted.
Traction
Information about the product's current traction such as specific user numbers, versions, or revenue growth is not made explicit in the provided data.
Market Size
The global market for video conferencing software was valued at approximately $6.03 billion in 2021 and is expected to grow as demand for integrated solutions increases.
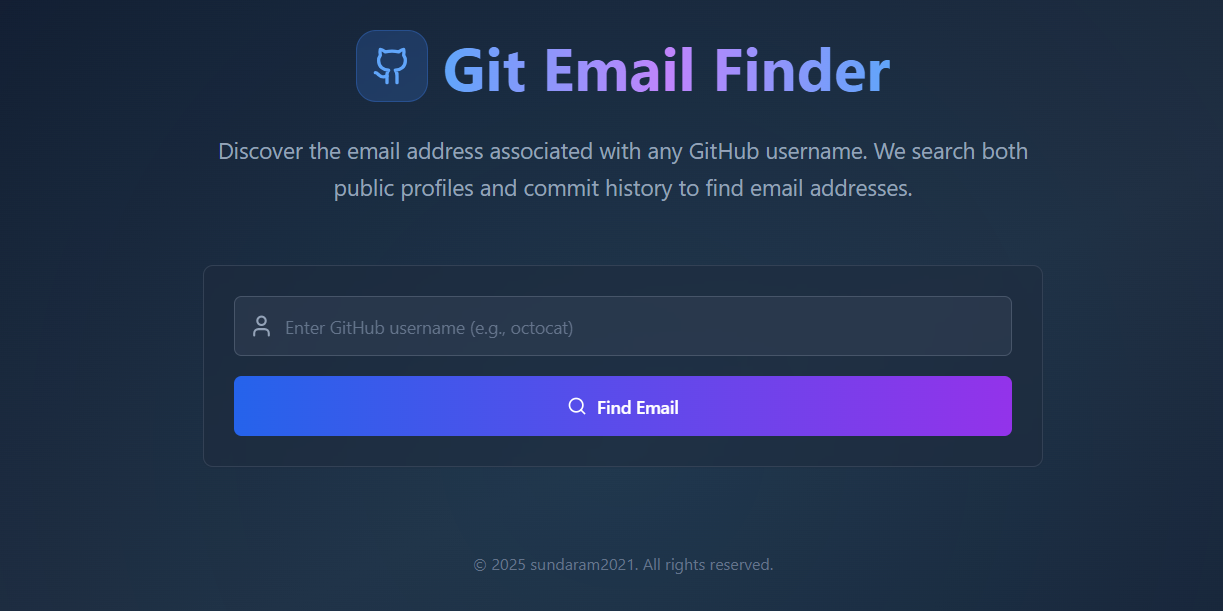
Problem
Users manually search for email addresses via GitHub profiles or guess email formats based on public data, leading to inefficiency and inaccuracy in acquiring contact information.
Solution
A developer tool that retrieves emails using GitHub usernames via API, enabling users to automatically fetch verified emails linked to GitHub accounts for outreach or collaboration.
Customers
Developers, recruiters, and sales professionals who need direct contact details of GitHub users for hiring, partnerships, or technical collaboration.
Unique Features
Direct integration with GitHub’s public data, real-time email validation, and bulk lookup capabilities via API.
Traction
Product details not specified on ProductHunt; traction data (e.g., users, revenue) unavailable from provided links. Founders’ social metrics or funding info not disclosed.
Market Size
The global recruitment market is valued at $760 billion (2023), with tech recruitment and sales outreach driving demand for email-finding tools.

