


Flow Finder (Excel add-in)
Alternatives
0 PH launches analyzed!

Flow Finder (Excel add-in)
Advanced dependency mapping for visual, recursive confidence
116

Problem
Users struggle with traditional formula tracing in Excel, facing challenges in understanding complex formula links and dependencies.
Solution
Excel add-in tool
Generates a visual network of all connections in Excel, providing a clear and recursive overview of formula dependencies.
Transforms formula tracing into a complete, visual network
Offers a detailed, intuitive Flow Map to visualize connections
Customers
Excel users, data analysts, financial analysts, project managers, students, researchers, and professionals working with complex Excel formulas and models.
Unique Features
Offers advanced dependency mapping for complex formula relationships
Provides a recursive visualization that simplifies understanding of formula connections in Excel
User Comments
Saves me a lot of time understanding complex Excel formulas and dependencies
Incredibly useful for project management and financial analysis
Highly recommend to anyone working with data in Excel
Great tool for students to learn and visualize formula connections
Intuitive and user-friendly interface
Traction
Currently no specific quantitative data available on traction, consider it a newly launched product with growing user interest
Market Size
Global market for Excel add-ins and tools is estimated to reach approximately $1.2 billion by 2026

Map Pathfinding Visualizer
Pathfinding visualizer on a real map, anywhere in the world
53
Problem
Users struggle to visualize how common pathfinding algorithms function on real-world streets. Traditional pathfinding tools do not illustrate the algorithms' behavior or efficiency on actual maps.
Solution
A website that offers a pathfinding visualizer, allowing users to see how common pathfinding algorithms behave on real-world streets. The visualization excludes traffic laws to focus purely on algorithm performance.
Customers
Developers, researchers, and educators interested in algorithmic efficiency, as well as enthusiasts in mapping technology and computational geography.
Unique Features
The ability to visualize pathfinding algorithms on real-world maps, offering insights into algorithm efficiency without the interference of traffic laws.
User Comments
Easy to understand algorithm behavior on actual maps.
Great tool for educational purposes in computer science.
Missing traffic law consideration can be a downside.
Intriguing for mapping technology enthusiasts.
Useful for preliminary research in computational geography.
Market Size
The global Geographic Information System (GIS) market was valued at $8.1 billion in 2020 and is expected to grow at a CAGR of 12.6% from 2021 to 2027.

Mindz - Mind Mapping
Structure ideas in lists and visualize them as a mind map.
114
Problem
Users struggle to organize their thoughts, ideas, and project plans efficiently, leading to inefficiency and scattered information.
Drawbacks: Lack of structure in information management, difficulty in visualizing connections between ideas, and challenges in presenting and sharing complex thoughts.
Solution
A web-based mind mapping tool that helps users structure their thoughts, collect ideas, plan projects using simple lists, and visualize them as mind maps.
Core features: Structuring thoughts with clear lists, effortless idea collection, easy project planning, beautiful visualization of nested lists as mind maps.
Customers
Students, professionals, project managers, designers, and creative thinkers looking to organize their ideas, streamline projects, and enhance brainstorming sessions.
Occupation or specific position: Project managers, designers, creative directors, students, educators.
Unique Features
Intuitive list-based organization system for thoughts and ideas.
Effortless transition from lists to visually appealing mind maps.
Seamless sharing and presentation of complex information and projects.
User-friendly interface for easy navigation and quick idea collection.
Customizable visualization options for tailored presentations and brainstorming.
User Comments
Easy-to-use tool for organizing thoughts and projects effectively.
Great visualization features making complex ideas easy to understand.
Saves time during brainstorming and planning sessions.
Helps in enhancing collaboration and communication among team members.
Regular updates and responsive customer support.
Traction
500k users actively use the tool monthly.
Recently launched a mobile app version to expand user accessibility.
$200k MRR with steady growth in user base and revenue.
Received $2 million in funding for further product development and marketing.
Positive reviews and high ratings on various platforms.
Market Size
$2 billion global market size for mind mapping software in 2021, expected to grow at a rate of 11% annually.
Increasing demand for efficient project planning and idea organization tools is driving market growth.
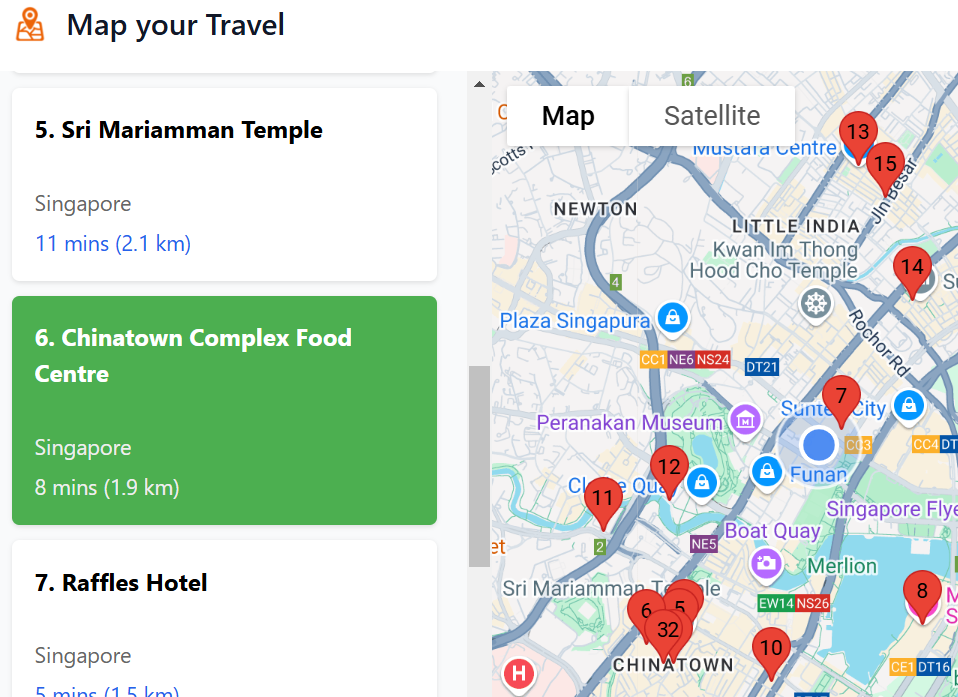
Map Your Travel
Map travel places on any webpage onto Google Maps
5
Problem
When readers look up food blogs or travel forums, they traditionally have to manually search each mentioned location on Google Maps, which is time-consuming and inefficient.
manually search each mentioned location on Google Maps
Solution
This is a browser extension that can identify and map every mentioned location, such as restaurants, onto Google Maps.
identify and map every mentioned location
Customers
Travel bloggers, food enthusiasts, and frequent travelers looking for a more efficient way to plan and execute their travel itineraries.
They are typically between the ages of 25-45 and frequently use online resources to plan trips and dining experiences.
Alternatives
View all Map Your Travel alternatives →
Unique Features
The extension instantly maps numerous locations from any webpage onto Google Maps, saving users time.
Includes travel times and distances between multiple points, enhancing route planning.
User Comments
Users appreciate the ease of use and time saved.
Some mention it enhances their travel planning experience.
A few comments suggest minor improvements for better user experience.
Users find it particularly useful for large cities with numerous dining options.
A small fraction of users mentioned occasional bugs.
Traction
Newly launched.
Featured on ProductHunt with increasing interest.
Market Size
The global travel technology market was valued at approximately $13.6 billion in 2022, with a continued growth trend as digital solutions for travel planning become more sought after.

Street View Live Satellite Map
Explore world with satellite map, get route planner with map
4
Problem
Users rely on traditional maps for navigation, lacking real-time visuals and interactive features.
Solution
Mobile application offering live street view satellite maps and instant GPS navigation with advanced 3D features.
Provides real-time 3D street map views, full-screen street map zooming, and instant GPS navigation.
Customers
Travelers who need precise navigation and real-time views for exploring unfamiliar areas.
Unique Features
Real-time 3D street map views
Full-screen street map zooming
Instant GPS navigation
User Comments
Easy to use and provides accurate navigation
Great visuals and interactive features
Helpful for planning routes and exploring new places
Enhances the travel experience
Improves safety and efficiency in navigation
Traction
Over 100k downloads on Google Play Store
Positive user ratings averaging 4.5 stars
Market Size
Global navigation app market size was valued at $39.7 billion in 2021
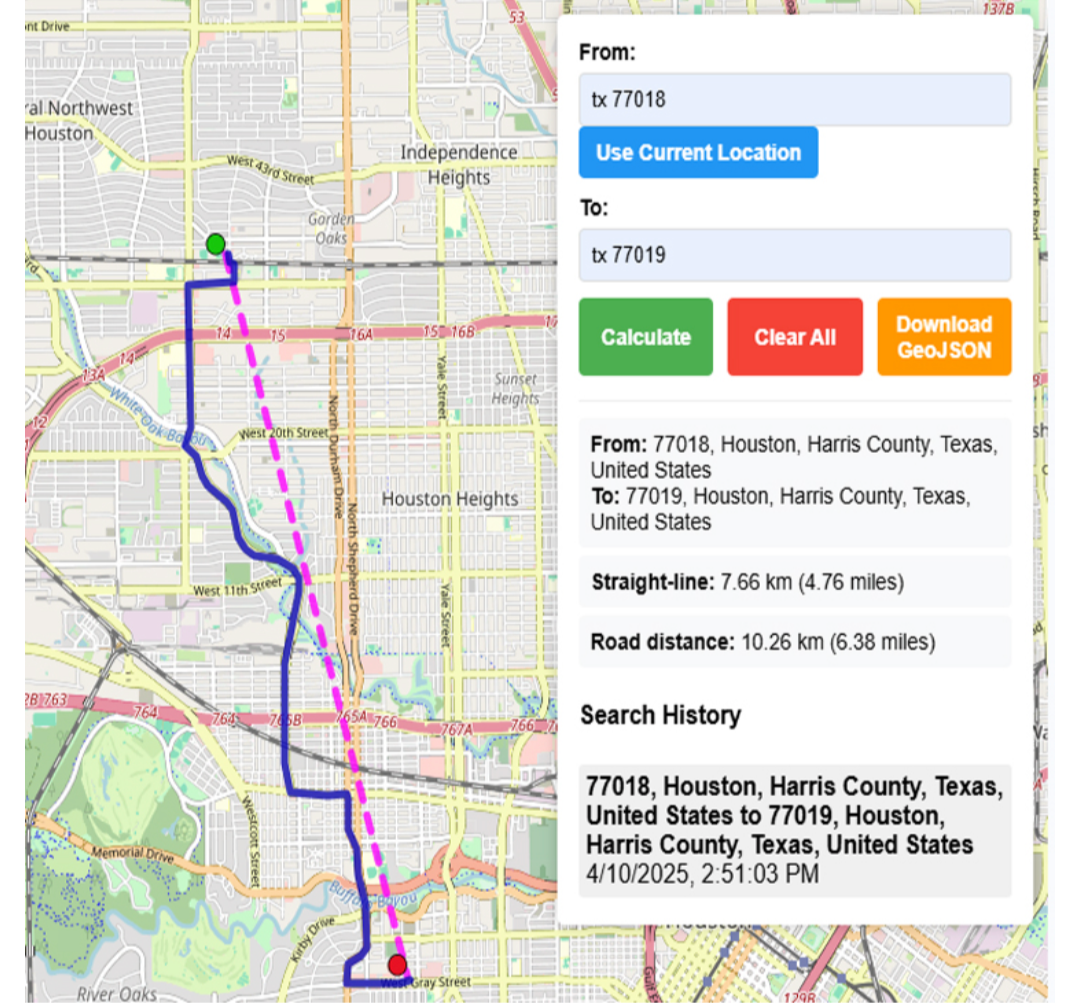
online map maker
freemaptools, gis, web map, mapping, build maps, geodata
3
Problem
Users need multiple specialized tools for different GIS tasks like viewing GPX files, calculating distances, and finding elevation data, leading to time-consuming and inefficient workflows.
Solution
A web-based GIS mapping platform that consolidates tools (e.g., GPX viewer, distance calculator, elevation finder) into one interface, enabling users to access all mapping features in a single platform.
Customers
Urban planners, logistics coordinators, environmental researchers, and field surveyors requiring frequent geodata analysis.
Unique Features
Comprehensive suite of 15+ free GIS tools integrated into one platform, eliminating the need for multiple subscriptions or software installations.
User Comments
Saves time by centralizing tools
Free access lowers entry barriers
User-friendly for non-experts
Useful for logistics route planning
Regularly updated features
Traction
50,000+ monthly active users, 4.7/5 rating on Product Hunt (300+ upvotes), freemium model with premium features generating $20k MRR
Market Size
The global GIS market is projected to reach $25.6 billion by 2030, growing at 12.1% CAGR (Grand View Research, 2023).

Visualize Web Link
Map and Optimize Your Links in a Visual Graph for Free
5
Problem
Users need to manage and visualize links between articles and websites.
The current solution involves manually tracking or using basic tools, which may not effectively show the relationships between content.
manually tracking or using basic tools
Solution
A tool that allows users to map and optimize their links in a visual graph.
manage and visualize links between articles and websites
Users can build graphs to track connections and optimize their link strategy automatically, with features like automatic link extraction and quick updates.
Customers
Medium writers
Content creators looking to better manage their link strategies
Bloggers who need to regularly optimize and update their web links.
Alternatives
View all Visualize Web Link alternatives →
Unique Features
Visual graph representation of link connections.
Free tool with automatic link extraction.
Quick update capabilities to maintain optimized link strategies.
User Comments
The tool is easy to use and extremely helpful for content strategy.
It saves a lot of time by automating link extraction.
Users appreciate the visual representation of their link networks.
Some users wish for more integration options.
It is particularly useful for those managing multiple articles or websites.
Traction
The product is featured on Product Hunt, indicating growing visibility.
It is a free tool, targeting a broad audience of content creators.
Market Size
The SEO software market was valued at $1.3 billion in 2020 and is expected to grow at a CAGR of 19.6% from 2020 to 2027.

Axonlotl Mind Map
mind mapping made easy
17
Problem
Currently, users attempting to organize complex information or brainstorm ideas often depend on traditional note-taking or digital text documents.
These methods are inefficient for visual thinkers and can lead to information overload and difficulty in managing complex data structures.
Solution
A browser-based mind mapping tool
Allows users to easily organize ideas and manage complex information through an intuitive interface and powerful customization options.
Customers
Visual thinkers, brainstorming beginners, advanced information strategists, students, educators, and professionals
Those particularly interested in systematic organization and visual learning
Unique Features
User-friendly browser-based interface
Advanced customization options for better information management
Designed to assist both beginners and advanced users in organizing ideas
User Comments
Users appreciate the ease of use and streamlined design.
There is notable satisfaction with the tool's customization options.
Some users have mentioned the tool enhances their productivity significantly.
Feedback often highlights the tool's ability to simplify complex brainstorming tasks.
Few users noted a desire for additional collaborative features.
Traction
Launched recently on Product Hunt
Gaining attention as a practical tool for brainstorming and idea organization
Attracting users interested in mind mapping techniques
Market Size
Mind mapping software market is projected to reach $417 million by 2026
Increasing demand for efficient information management and visual thinking tools

Topical Map Creator
Topical map generator
6
Problem
Users face challenges in creating visually attractive topical maps for their websites
Drawbacks: Difficulty in designing topical maps from scratch, time-consuming process, lack of design skills may result in unappealing maps
Solution
Online tool (Topical Map Creator)
Users can instantly create visually attractive topical maps for their websites
Core features: Instant creation of topical maps, visually attractive designs, user-friendly interface
Customers
Website owners, bloggers, educators, marketers, researchers
Occupation: Content creators, SEO specialists, educators
Unique Features
Instant creation of visually attractive topical maps
User-friendly interface for easy map generation
User Comments
Easy-to-use tool for creating topical maps
Great for adding visual elements to websites
Saves time and effort in map design
Useful for educational purposes
Helps in presenting data in an engaging way
Market Size
$5.3 billion was the global market size for data visualization tools in 2021
(Source: Grand View Research)

Code Mind Map
A mind mapping VS/Code extension with nodes liked to code.
6
Problem
Users struggle to visualize complex code structures and navigate between code sections efficiently, relying on manual search or bookmarks, leading to time-consuming and error-prone code analysis.
Solution
A VS Code extension enabling users to create interactive mind maps with nodes directly linked to code snippets. Example: Developers can select code blocks, add them as map nodes, and click nodes to jump to the corresponding code.
Customers
Developers, software engineers, and technical leads (ages 25–40) working on large codebases in tech companies or startups, prioritizing code organization and collaboration.
Unique Features
Seamless bidirectional navigation between mind maps and code within VS Code, eliminating context-switching between IDEs and external diagramming tools.
User Comments
Saves hours in codebase exploration
Intuitive visual representation of dependencies
Essential for onboarding new developers
Improves debugging efficiency
Integrates smoothly with VS Code workflow
Traction
Launched on ProductHunt with 112 upvotes (as of analysis), positioned as a niche tool with early-stage adoption in developer communities.
Market Size
The global developer tools market is projected to reach $6.5 billion by 2025 (Source: Statista), with code navigation/analysis tools capturing ~15% share (~$1 billion).