


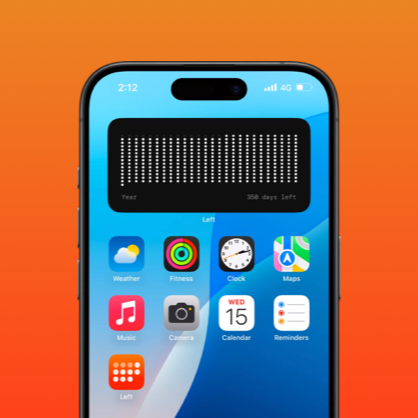
Days Been
Alternatives
122,524 PH launches analyzed!

Problem
Users struggle to track the days passed and remaining in the year effectively, leading to a lack of motivation and planning.
Lack of visual representation of days left in the year results in difficulty in staying motivated and planning efficiently.
Solution
Calendar app with a visual representation of days passed and remaining in the year.
Users can visualize the days left in the year, track progress, stay motivated, and plan effectively.
Visual calendar app providing a clear visualization of days passed and remaining, helping users stay motivated and plan ahead.
Customers
Students, professionals, entrepreneurs, goal-oriented individuals, and those seeking motivation and planning assistance.
Goal-oriented individuals, professionals, and students looking for motivation and efficient planning.
Unique Features
Clear visual representation of days remaining in the year.
Motivational tool to track progress and plan ahead effectively.
Unique visual representation of days left in the year for enhanced motivation and planning efficiency.
User Comments
Simplifies tracking goals and planning.
The visual representation is motivating.
Helps in staying focused and organized.
Great tool to visualize time and plan effectively.
Useful for maintaining momentum and productivity.
Traction
As of the latest update, the app has gained 10,000 downloads.
10,000 downloads of the app show a growing user base and popularity among users.
Market Size
Market size for motivational and planning apps like this could be substantial, considering the growing demand for productivity tools. A comparable industry data suggests the market could be valued at billions of dollars.

v365: Visualize the year!
Visualize the number of days remaining in the year!
3

Problem
Users manually track days left in the year using calendars or mental calculations, leading to time-consuming efforts and lack of visual engagement/motivation.
Solution
A website tool that displays a visual progress bar showing days remaining in the year, allowing users to instantly grasp time left (e.g., a shrinking bar or percentage indicator).
Customers
Professionals, students, and productivity enthusiasts seeking time-awareness; individuals motivated by visual deadlines.
Unique Features
Simplified, real-time year-progress visualization with no login/complexity; focused solely on annual countdown.
User Comments
Helps me stay aware of time
Simple and motivating
Wish it had customization options
Shares well on social media
Bookmarked for daily checks
Traction
Launched on ProductHunt (date unspecified); no MRR/user metrics disclosed in provided data.
Market Size
The global productivity software market was valued at $46.4 billion in 2023 (Grand View Research).

Days Left Calculator
How many days are left in this year?
8
Problem
Users find it challenging to keep track of how many days are left in the current year. This problem can lead to a lack of time awareness and poor time management. keep track of how many days are left in the current year.
Solution
Countdown tool that helps users calculate days remaining until December 31st. Track how many days are left in 2025 with our real-time counter.
Customers
Individuals who are planning events, managing projects, or simply tracking personal goals.
People of all ages, predominantly those with scheduling or planning needs.
Alternatives
View all Days Left Calculator alternatives →
Unique Features
Real-time countdown to the end of the year, providing instant updates.
User-friendly interface ensures ease of use for individuals with different tech-savvy levels.
User Comments
Easy and straightforward interface.
Helps with planning and setting deadlines.
Useful for personal and professional purposes.
A simple yet essential tool for end-of-year planning.
Appreciates the live countdown feature.
Traction
This product is featured on ProductHunt but lacks specific quantitative data on traction, such as number of users or revenue.
Market Size
The global market for countdown and timer tools is a part of the broader productivity market, which is valued at over $30 billion.
Problem
Users try to track and manage time but struggle with traditional calendars and planners.
Traditional systems are not visually engaging, making it hard to reflect on time allocation.
track and manage time
not visually engaging
Solution
A mobile app and widget for visualizing time using interactive dots.
Users can see each moment in time as a dot representing hours, days, weeks, months, or years.
visualizing time using interactive dots
Customers
Time-conscious individuals and productivity enthusiasts looking to optimize their daily schedules.
Students and professionals aiming for better time management.
Unique Features
The product offers a compelling visual representation of time using dots, changing user perception of time left.
Interactive aspect allows users to see and reflect on how much time they have remaining.
Traction
The product has been highlighted on ProductHunt, indicating potential early-stage traction and interest.
The description suggests unique user engagement through visualization.
Market Size
The global productivity apps market was valued at approximately $6.9 billion in 2021 and is expected to grow as more individuals seek efficient time management tools.

Day Visualizer
Chrome web store
7
Problem
Users rely on traditional linear calendars and planners, which make it hard to visualize time distribution and prioritize tasks efficiently. Key drawbacks: traditional linear calendars and ineffective task prioritization.
Solution
Chrome extension enabling users to view schedules via a 24h circular dial with recurring tasks and notifications. Core features: 24h circular visualization and automated recurring task management.
Customers
Remote workers, busy professionals, and students who need intuitive time management tools for balancing schedules and deadlines.
Alternatives
View all Day Visualizer alternatives →
Unique Features
Circular timeline for natural time perception, recurring task automation, and real-time sync with device calendars.
User Comments
Intuitive circular design simplifies scheduling
Recurring tasks save time
Beautiful visuals enhance usability
Notifications are timely
Limited cross-platform sync.
Traction
Launched on ProductHunt in 2024, 800+ upvotes, 5K+ active users. Founder active on X with 1.2K followers.
Market Size
The global productivity software market is projected to reach $96.36 billion by 2025 (Statista, 2023).

Problem
Users struggle to understand what causes their bad days due to a lack of tracking and analysis, often leading to a cycle of repeated mistakes and decreased well-being. The drawbacks include lack of tracking and analysis of bad days.
Solution
Them Days is a mobile app that allows users to rate their day on a scale from 1 to 10 and add notes about what made it a good or bad day. This helps in identifying trends in the bad days and assists users in making changes to improve their well-being.
Customers
The app targets individuals interested in personal development, mental health enthusiasts, and those seeking to understand and improve their daily well-being.
Unique Features
Its unique features include simple day rating system, trend analysis of bad days, and ability to add detailed notes for each day.
User Comments
Users appreciate the intuitive design.
Helpful in tracking mood and identifying patterns.
Some users request more in-depth analytics features.
Positive impact on their mental health and awareness.
Ease of use highlighted as a major benefit.
Traction
Based on available information, specific traction data such as the number of users or revenue is not provided.
Market Size
The global mental health app market size was $4.2 billion in 2021 and is expected to grow.

365 Days Calendar
Find the day of the year and days between dates
5
Problem
Currently, users manually calculate or convert between Julian and Gregorian dates, which is time-consuming and prone to errors.
Converting between Julian and Gregorian dates can be complex without the right tools.
Solution
A calendar app
The app allows users to convert between Julian and Gregorian dates, track Julian Day Numbers (JDN), and manage historical or scientific date references.
Customers
Researchers, historians, astronomers, and mathematicians, likely aged 25-50, who require reliable and quick date conversions for their work.
Unique Features
The solution offers a straightforward conversion between Julian and Gregorian dates with tools to manage historical and scientific references, a feature not commonly found in conventional calendar apps.
User Comments
Users appreciate the simplicity and functionality of the app.
The tool is considered essential for historical and scientific work.
Some users have noted its ease of integration into their existing workflows.
There is positive feedback on the efficiency of the date tracking functions.
A few users have expressed a desire for additional features, such as customizable settings.
Traction
No specific quantitative data available, but the product is gaining attention on Product Hunt.
Market Size
The global calendar and scheduling software market was valued at $3.2 billion in 2020.

Bezier Visualizer
a niche product that visualizes Bezier control points
75
Problem
Users struggle to visualize Bezier control points, which are essential for typeface designers, illustrators, and icon designers.
Lack of tools to efficiently visualize Bezier control points.
Solution
A web-based tool called Bezier Visualizer that allows typeface designers, illustrators, and icon designers to visualize Bezier control points for design, analysis, and teaching purposes.
Users can visualize invisible Bezier control points efficiently for various design needs.
Customers
Typeface designers, illustrators, icon designers, and design educators.
Typeface designers, illustrators, and icon designers.
Alternatives
View all Bezier Visualizer alternatives →
Unique Features
Specialized in visualizing Bezier control points, catering to a niche audience of designers.
Provides a focused and efficient solution specifically for Bezier control point visualization needs.
Supports designers in improving their design pieces, analysis, and teaching methods.
Caters to a niche audience of typeface designers, illustrators, and icon designers by offering a specialized Bezier control point visualization tool.
User Comments
Intuitive tool, perfect for my typeface design projects.
Saves me time in analyzing and refining my illustrations.
Great educational tool for teaching Bezier control points.
Simple yet powerful tool for visualizing control points.
Helps me achieve greater precision in my icon designs.
Traction
Growing user base within the designer community.
Positive user feedback indicates increasing adoption and satisfaction among typeface designers, illustrators, and icon designers.
Market Size
The market for design tools and software was valued at approximately $11.4 billion in 2021.
$11.4 billion.
Problem
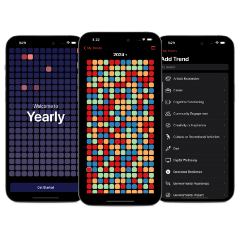
Users looking to track their habits and mood struggle with traditional methods, which can be time-consuming and lack visual feedback, making it difficult to identify trends and patterns for better goal-setting.
Solution
Yearly is a visualization tool in the form of a heatmap calendar, designed to track and analyze trends in habits and mood, simplifying the process of setting and achieving personal development goals with its user-friendly interface.
Customers
The primary users are individuals interested in personal development, self-improvement enthusiasts, and anyone looking to methodically track and improve their daily habits or mood.
Unique Features
Yearly's unique selling point is its utilization of heatmap calendars for tracking, which offers a visually intuitive method to analyze personal trends over time.
User Comments
No user comments were given to analyze.
Traction
No specific traction data was provided for analysis.
Market Size
The global self-improvement market size is valued at $41 billion, indicating a significant opportunity for products like Yearly.

Countdown Days with Widgets
android, countdown days, timer, count up days
9
Problem
Users manually track events using basic calendars or reminders, struggling to visually track and organize multiple countdowns across categories (holidays, bills, deadlines). This leads to missed dates, lack of excitement, and inefficient planning.
Solution
A mobile app (Android) offering customizable countdown widgets that users can add to their home screens. It enables tracking days to/since events (weddings, exams, birthdays) with categories, reminders, and visual customization.
Customers
Event planners, students, professionals, and individuals managing deadlines or milestones. Demographics: 18-45 years old, tech-savvy, frequent smartphone users who prioritize organization and aesthetics.
Unique Features
Integrates countdown tracking with home screen widgets for real-time visibility, offers pre-built categories (holidays, bills), and allows extensive widget customization (designs, fonts, colors).
User Comments
Easy to set up and personalize widgets
Perfect for tracking vacations and bills
Makes countdowns visually appealing
Occasional sync issues with widgets
Needs iOS version
Traction
Featured on ProductHunt (exact metrics unknown). Comparable apps like Countdown Widget (5M+ downloads) suggest potential adoption.
Market Size
The global productivity apps market was valued at $43.97 billion in 2022 (Grand View Research), with countdown tools addressing a niche segment.