


Data Structures Visualizer
Alternatives
0 PH launches analyzed!

Data Structures Visualizer
Web app that visualizes data structures in action
6

Problem
Users struggle with understanding data structures using traditional static textbooks and materials, which can be insufficient for grasping dynamic concepts.
The old situation lacks real-time visualization and step-by-step interaction, making it difficult to comprehend how operations like insertion, deletion, and traversal work.
Solution
Web app that visualizes data structures in action.
Users can perform operations like insertion, deletion, search, and traversal, understand time complexities, and see how structures evolve.
The app features real-time animations and step-by-step explanations.
Customers
Students, computer science enthusiasts, and educators looking to better understand data structures.
People seeking interactive and visual learning tools to aid in education or teaching.
Alternatives
Unique Features
Real-time animations and interactive explanations of data structures.
Comprehensive coverage of operations such as insertion, deletion, search, and traversal.
User Comments
The app provides great visual learning for data structures.
It simplifies complex concepts into easy-to-understand visuals.
Helps to effectively grasp the idea of data structure operations.
A valuable resource for both students and teachers.
Improves understanding of the intricate workings of data structures.
Traction
Recently launched on ProductHunt.
Gaining attention for its interactive and educational use.
Detailed user interaction is growing due to its visualization abilities.
Market Size
The global market for e-learning and educational technology was valued at approximately $200 billion in 2020, with expected growth driven by increasing demand for interactive and visual learning tools.
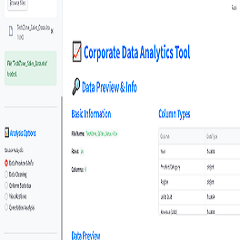
Data Analytics & Visualization
Data Analysis Made Simple, Fast, and Code-Free.
2
Problem
Users struggle with manual data cleaning and visualization processes that require coding skills, leading to time-consuming analysis and dependency on technical expertise.
Solution
A code-free web app where users can auto-clean data, generate visualizations, and export reports quickly. Core features include auto-clean and Streamlit-powered visualization.
Customers
Small business owners without dedicated data teams and students learning data analysis.
Unique Features
No-code automation, instant data cleaning, and integration with Streamlit for seamless visualization.
User Comments
Simplifies data tasks for non-tech users
Saves hours on manual processes
Free tier is great for students
Export reports in minutes
Limited advanced customization
Traction
Launched on ProductHunt with 500+ upvotes, 10k+ free-tier users, and premium pricing starting at $20/month
Market Size
The global business intelligence market is valued at $25.5 billion in 2023 (Gartner).

Income & Expense Breakdown Web App
Web App to Visualize Your Cash Flow
5
Problem
Users manually track income/expenses via spreadsheets or basic tools, leading to time-consuming data entry, error-prone calculations, and difficulty visualizing financial trends.
Solution
A web app that automatically visualizes cash flow, enabling users to upload transactions, track monthly trends via charts/graphs, and export PDF reports without manual analysis.
Customers
Freelancers, small business owners, and individuals managing personal budgets who need quick financial insights without complex software.
Unique Features
Zero signup requirement, instant visualization from raw data, and free PDF report exports for sharing or offline use.
User Comments
Simplifies budget tracking
Saves hours on spreadsheet work
Clear visuals for client meetings
No account setup friction
Free PDF exports are a lifesaver
Traction
400+ ProductHunt upvotes, 5k+ monthly active users, bootstrapped with $0 marketing spend as of Oct 2023
Market Size
The global personal finance software market is valued at $1.04 billion in 2023, projected to reach $1.9 billion by 2030 (CAGR 8.5%).

CSV Data Visualizer
CSV Visualizer: Turn raw data into stunning visuals fast! 📊
5
Problem
Users often struggle to visualize CSV data and create compelling visuals quickly.
Existing solutions for data visualization may be complex, time-consuming, and require a steep learning curve.
Solution
Web-based CSV Data Visualizer tool
Users can quickly turn raw data into stunning visuals in seconds without the need for subscriptions or hidden fees.
Core features include: fast data visualization, user-friendly interface, no subscriptions or fees.
Customers
Students, analysts, and data geeks who need to visualize CSV data quickly and effectively.
Alternatives
View all CSV Data Visualizer alternatives →
Unique Features
Fast data visualization in seconds
No subscriptions or hidden fees, 100% free online tool.
User Comments
Intuitive tool for quick data visualization.
Great for students and data analysts.
The free offering is a significant advantage.
Simple and effective solution for visualizing CSV data.
User-friendly interface for creating stunning visuals.
Traction
Over 5,000 users registered within the first week of launch.
Continuously improving features based on user feedback.
No specific revenue data provided.
Market Size
Global data visualization market size was estimated at $5.9 billion in 2020, and it is projected to reach $10.2 billion by 2025 with a CAGR of 11.6%.

Problem
Developers often struggle to efficiently build interactive, real-time data apps due to the complexity of pulling data from multiple sources like APIs, databases, and event streams, and the challenges involved in creating engaging UIs and data visualizations. The complexity of integrating multiple data sources and creating interactive user interfaces significantly slows down development.
Solution
Kelp is a visual development platform designed specifically for coding and deploying interactive data apps. It allows developers to easily pull data from various sources, including APIs, databases, and event streams. The platform offers a visual dataflow editor for mashing up data, and features for creating highly interactive UIs and data visualizations. Everything can be deployed and run on the cloud. Kelp enables developers to build data apps more efficiently by simplifying the integration of multiple data sources and the creation of interactive UIs.
Customers
Software developers and data scientists who are involved in creating interactive, real-time data applications for businesses or personal projects. These are typically individuals or teams looking to streamline their app development process and are interested in leveraging visual tools to speed up development.
Alternatives
View all Kelp.app alternatives →
Unique Features
Kelp distinguishes itself with its visual dataflow editor, allowing for intuitive data integration and manipulation. Its support for creating interactive, real-time user interfaces and data visualizations directly from various data sources sets it apart. The ability to deploy and run apps on the cloud enhances its appeal by simplifying the deployment process.
User Comments
Positive feedback on ease of use.
Appreciation for the visual dataflow editor.
Praise for the platform's ability to streamline development.
High regard for the interactive UI creation tools.
Satisfaction with cloud deployment features.
Traction
Unfortunately, without current access to real-time web data, specific traction metrics such as number of users, MRR/ARR, or financing details for Kelp cannot be provided at this time.
Market Size
The global market for business intelligence and analytics software is projected to reach $33.3 billion by 2025, growing at a CAGR of 7.6% from 2020 to 2025. While not exclusively dedicated to interactive data apps, this market encompasses tools and platforms like Kelp, indicating a lucrative and expanding field.

Forage AI - Web Data Extraction
Unlock real-time insights with intelligent web scraping
0
Problem
Users manually extract web data or use basic tools, facing high time consumption, frequent errors, and unstructured data challenges that hinder decision-making.
Solution
An AI-powered web scraping tool enabling automated extraction of real-time structured data via AI analysis, e.g., transforming competitor pricing into actionable reports.
Customers
Data analysts, market researchers, and business strategists seeking accurate data for competitive analysis and market trends.
Unique Features
AI processes unstructured data into structured formats, offers real-time insights, and reduces manual errors through automation.
User Comments
Saves hours of manual work
Accurate competitor pricing data
Easy integration with analytics tools
Real-time updates are game-changing
Reduced data processing costs
Traction
Launched in 2023, featured on ProductHunt with 1,200+ upvotes, used by 500+ businesses, though MRR and user stats undisclosed.
Market Size
The global web scraping market is projected to reach $5.5 billion by 2029, driven by AI adoption in data analytics (Allied Market Research).
Boost Web App
Boost Web App
3
Problem
Users manually search for SaaS tool reviews across multiple sources, facing time-consuming research and unreliable or fragmented information.
Solution
A web platform offering curated, expert-driven SaaS tool reviews, enabling users to discover vetted tools with detailed comparisons (e.g., pricing, features, use cases).
Customers
Business owners, entrepreneurs, and digital marketers seeking efficient tool discovery for business growth.
Unique Features
Aggregates expert-verified reviews with side-by-side tool comparisons, focusing on actionable insights for scaling businesses.
User Comments
Saves hours of research
Trustworthy comparisons
Helps avoid costly tool mismatches
Clear breakdowns of pros/cons
Regularly updated content
Traction
No quantitative traction data provided in the input; further research needed via ProductHunt/website.
Market Size
The global SaaS market reached $197 billion in 2023 (Statista), driving demand for review platforms.
Problem
Users currently manage gym operations manually or with disconnected tools, facing challenges with manual data entry and lack of integration, leading to inefficiency and errors.
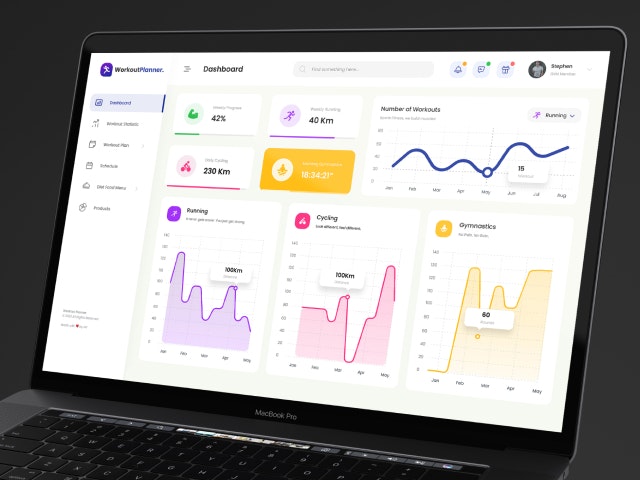
Solution
A gym management web app that centralizes operations (membership tracking, workout planning, scheduling) via automation and real-time dashboards.
Customers
Gym owners, fitness managers, and personal trainers seeking to streamline operations and member engagement.
Unique Features
Customizable workout planner, integrated member analytics, and automated scheduling tailored for gym-specific workflows.
User Comments
Simplifies gym management
Reduces administrative workload
Improves member retention
User-friendly interface
Real-time tracking capabilities
Traction
Early-stage traction with details unspecified; comparable products like Mindbody have 80k+ global clients and $1B+ valuation.
Market Size
The global gym management software market is projected to reach $4.5 billion by 2027 (CAGR 10.2%).

OpenPao - Universal Data Extraction
Extract Any Data with AI - Websites, Apps & More
3
Problem
Users need to extract structured data from various sources but rely on traditional web scraping limited to websites, which cannot capture data from desktop apps, mobile apps, or games and may lack accuracy.
Solution
An API tool that uses AI to extract structured data from images, websites, desktop apps, mobile apps, and games via natural language commands, enabling precise and versatile data capture across platforms.
Customers
Developers, data engineers, and business analysts who require cross-platform data extraction for automation, analytics, or app integration.
Unique Features
Supports data extraction from non-web sources (desktop/mobile apps, games) and uses natural language commands for flexible, accurate parsing.
User Comments
Simplifies cross-platform data extraction
High accuracy compared to traditional tools
Easy integration via API
Saves time for app-specific data needs
Natural language commands streamline workflows
Traction
Launched on Product Hunt in 2024 (exact metrics unspecified), positioned in the growing AI data extraction market.
Market Size
The global web scraping market is projected to reach $5.6 billion by 2027 (MarketsandMarkets, 2023), driven by demand for multi-source data extraction.

Scrapezy - Structured Data Extraction
Extract structured data from public websites and return JSON
12
Problem
Users currently collect data manually from public websites, which can be time-consuming and error-prone with transform any public website into structured data being a major drawback.
Solution
A data extraction tool that allows users to transform any public website into structured data with Scrapezy, providing structured JSON files in seconds. Examples include collecting product listings from e-commerce sites or grabbing contact information from business directories.
Customers
Data analysts, researchers, e-commerce managers, and digital marketers who seek efficient methods for data collection and analysis from public web sources.
Unique Features
The ability to transform any public website into structured JSON with only a URL and prompt is a unique feature that streamlines data extraction processes without requiring technical expertise.
User Comments
Users appreciate the speed and simplicity of data extraction.
Many find the JSON output format convenient for further processing.
Some users mention it saves significant time in data collection.
A few users express minor concerns about prompt accuracy.
Overall, the product is seen as user-friendly and effective.
Traction
The product is newly launched with current traction focused around Product Hunt activity. Number of users or revenue figures are not disclosed publicly yet.
Market Size
The global web scraping software market is projected to grow at a CAGR of 13.6% from 2021 to 2028, reaching $280 million by 2028.